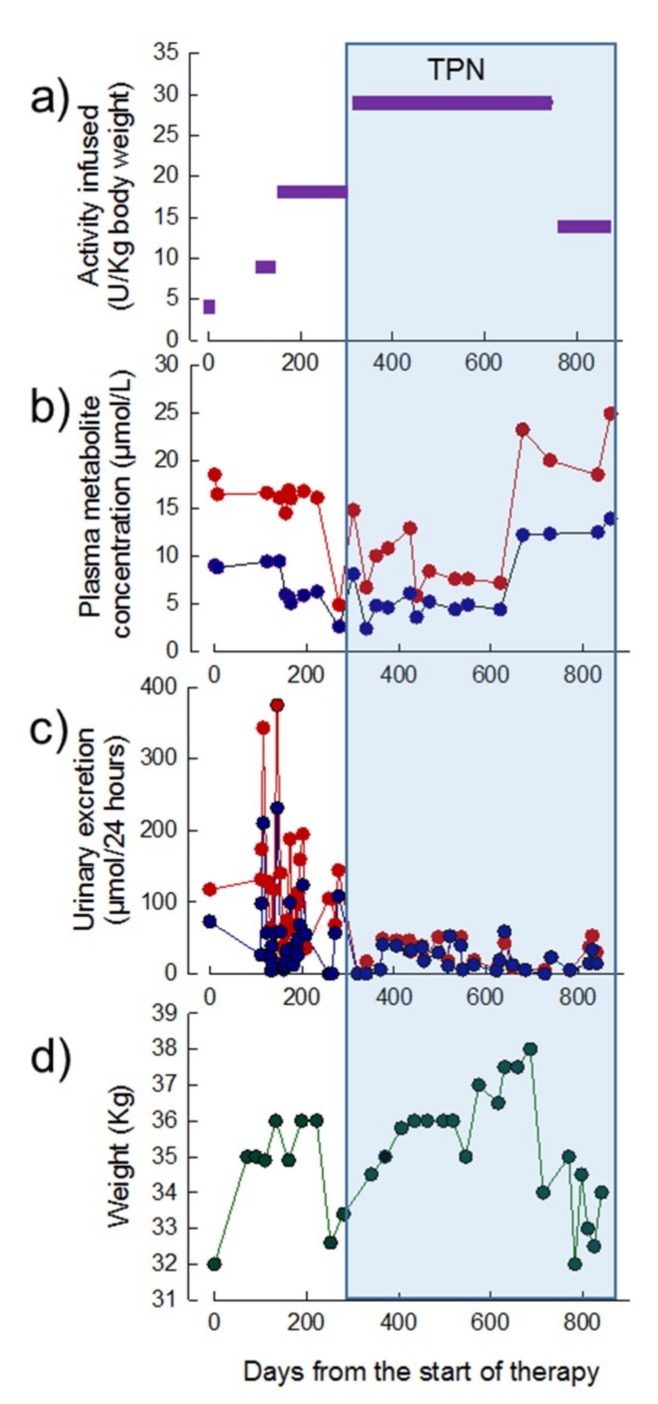
Figure 4.
Dose of EE-TP administered, plasma concentrations of deoxyribonucleosides, urinary excretion of deoxyribonucleosides, and body weight in Patient 1 during 28 months of therapy with EE-TP. (a) The dose of encapsulated thymidine phosphorylase infused was determined using high performance liquid chromatography (HPLC). (b) Mid cycle plasma thymidine (blue data points) and deoxyuridine (red data points) concentrations were measured by Ultra-Performance Liquid Chromatography (UPLC). (c) Mid cycle urinary excretions of thymidine (blue data points) and deoxyuridine (red data points) were determined by measuring the concentration of metabolites in 24 h urine collections. (d) Patient body weight. The blue shaded area represents the timeframe in which TPN was administered.

