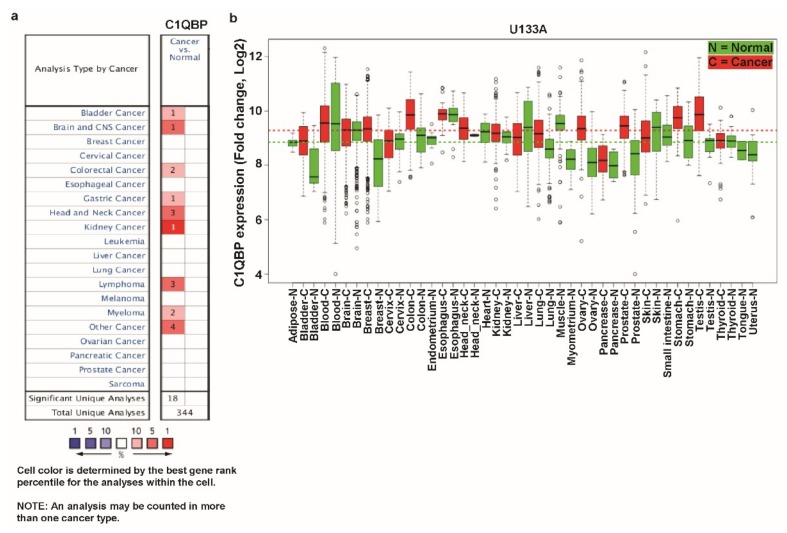
Figure 1.
Transcription levels of C1QBP (Complement Component 1 Q Subcomponent-Binding Protein) in different types of cancer using the Oncomine and Gene Expression Across Normal and Tumor Tissue (GENT) databases. (a) This graphic was generated from the Oncomine database (available at https://www.oncomine.org/resource/login.html), indicating the number of datasets with statistically significant (p < 0.01) mRNA over-expression (red) or under-expression (blue) of C1QBP (different types of cancer vs. corresponding normal tissue). The threshold was designed with following parameters: p-value of 1e−4, fold change of 2, and gene ranking of 10%. (b) Expression pattern of C1QBP mRNA in normal and tumor tissues. C1QBP mRNA expression in various types of cancer was searched in the GENT database (available at http://medical-genomics.kribb.re.kr/GENT/). Boxes represent the median and the 25th and 75th percentiles; dots represent outliers. Red boxes represent tumor tissues; green boxes represent normal tissues. Red and green dashed lines represent the average value of all tumor and normal tissues, respectively. Abbreviations. CNS: central nervous system.

