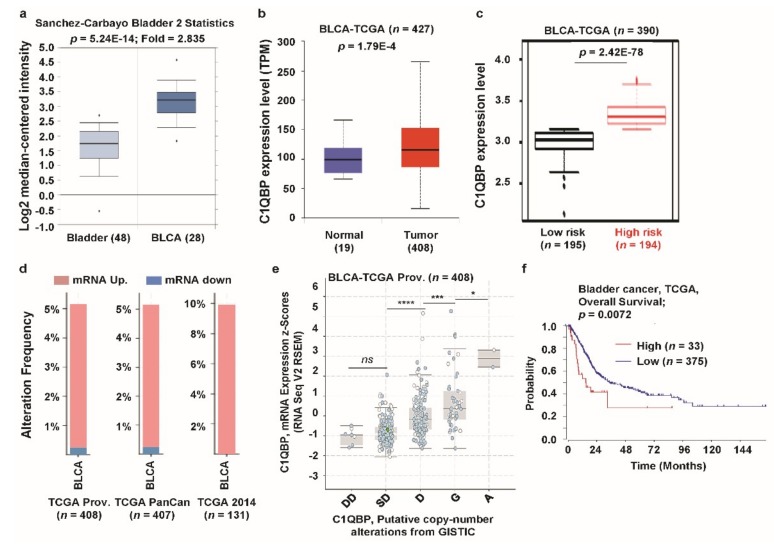
Figure 5.
C1QBP expression pattern and patient survival analysis in bladder cancer, compared to C1QBP expression in normal tissue and cancer tissue. (a) The fold-change of C1QBP in bladder cancers was identified by our analyses, shown as a box plot. The box plot comparing specific C1QBP expression in normal (n = 48, left plot) and cancer tissue (n = 28, right plot) was derived from the Oncomine database. The analysis was shown in BLCA relative to in normal bladder. The asterisk above and below the box represent maximum and minimum value, respectively. (b) Expression of C1QBP gene in The Cancer Genome Atlas (TCGA) database. Box plots showing the C1QBP mRNA expression in BLCA tumor (red plot) and their normal (blue plot) tissues, using data from TCGA database through ULCAN. (c) C1QBP gene expression in BLCA patients from TCGA database. The box-plots generated using SurvExpress biomarker validation tool showing the gene expression in BLCA patients using cohorts from datasets generated by TCGA (n = 390). Box-plots show expression levels and p-values resulting from t-test of the difference expression between high-risk (red) and low-risk (green) groups in BLCA patients. (d) Alterations (mRNA upregulation/downregulation) of the C1QBP gene in BLCA (TCGA Prov., n = 408; TCGA PanCan atlas, n = 407; TCGA 2014, n = 131). Data were obtained using cBioPortal. (e) C1QBP mRNA expression was significantly associated with the copy number alteration status (ANOVA, p < 0.0001) in bladder cancer. (*: p < 0.05; ***: p < 0.001; ****: p < 0.0001; ns: nonsignificant). (f) The survival curve comparing patients with high (red) and low (blue) expression in bladder cancer was plotted from the R2: Genomics Analysis and Visualization Platform. Survival curve analysis was conducted using a threshold Cox p-value < 0.05.

