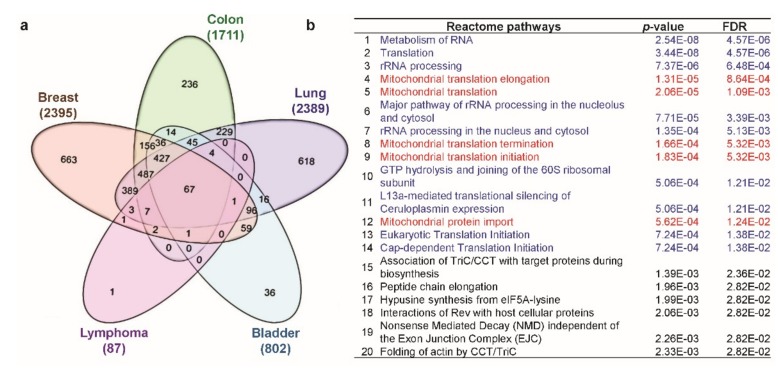
Figure 7.
Analysis of positively correlated genes of C1QBP and their predicted pathway analysis using Reactome pathway analysis. (a) Venn diagram of genes positively correlated to C1QBP, showing coincident genes in breast, colon, lung, bladder, and lymphoma cancers. (b) Pathway analysis using Reactome pathway analysis. Gene ontology (GO) analysis using GOTermFinder functional annotation tool v1.0 is shown in Supplementary Table S9.

