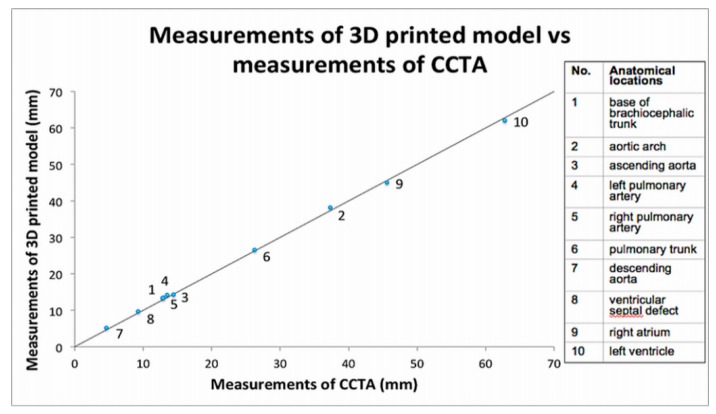
Figure 3.
Scatterplot showing measurements of 3D printed model in comparison with those from cardiac computed tomography (CT) images at 10 anatomical locations. CCTA—cardiac computed tomography angiography. Reprinted with permission under the open access from Lau et al. [16].

