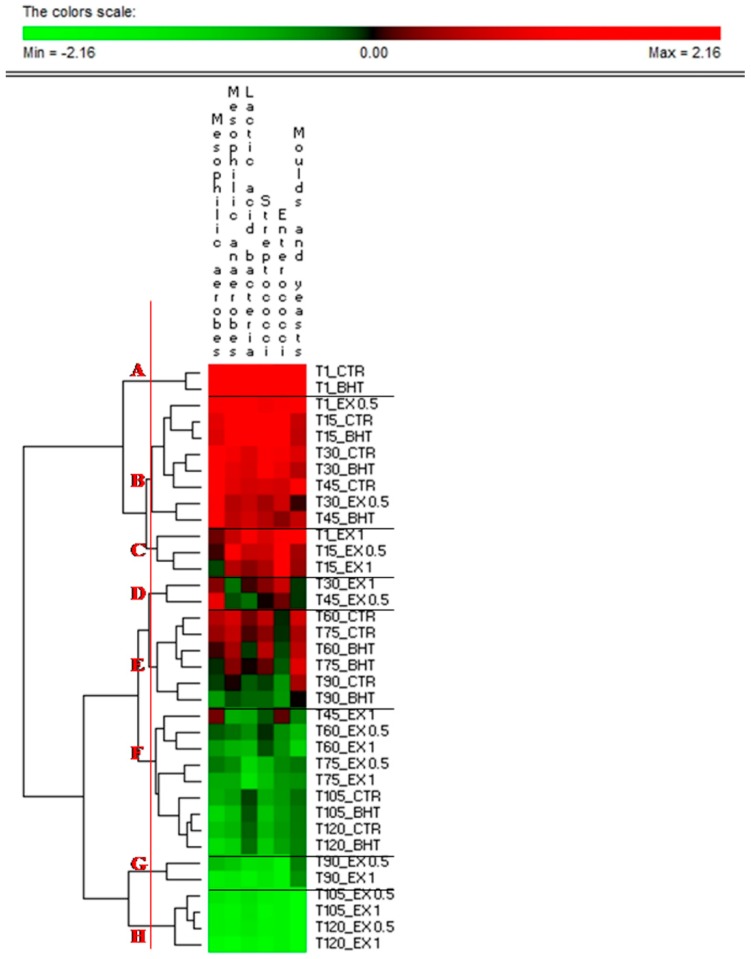
Figure 2.
Permutation analysis of cell density during storage of olive-based paste. Euclidean distance and McQuitty’s criterion (weighted pair group method with averages) were used for clustering. The colours correspond to normalized mean data levels from low (green) to high (red). The colour scale, in terms of units of standard deviation, is shown at the top. Eight clusters are identified by the letters A-H. CTR: control samples; BHT: olive-based paste added of butylated hydroxytoluene; EX0.5: olive-based paste added of 0.5 g kg−1 of olive leaves extract; EX1: olive-based paste added of 1 g kg−1 of olive leaves extract; T1, T15, T30, T45, T60, T75, T90, T105, and T120: 1, 15, 30, 45, 60, 75, 90, 105 and 120 storage days.

