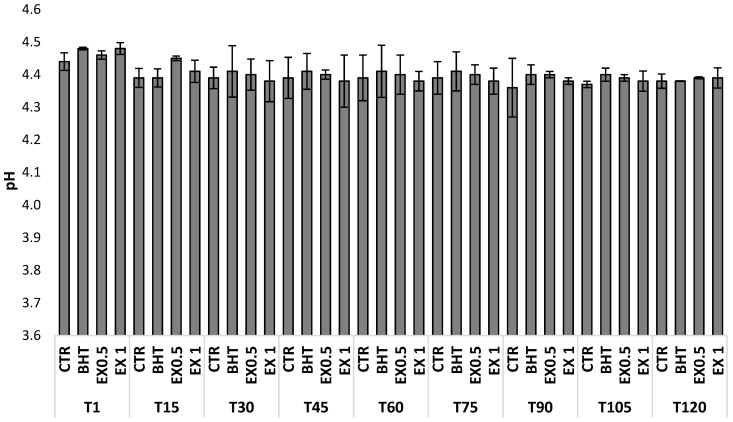
Figure 3.
Trend of the pH variations during storage of olive-based paste. CTR: control samples; BHT: olive-based paste added of butylated hydroxytoluene; EX0.5: olive-based paste added of 0.5 g kg−1 of olive leaves extract; EX1: olive-based paste added of 1 g kg−1 of olive leaves extract; T1, T15, T30, T45, T60, T75, T90, T105, and T120: 1, 15, 30, 45, 60, 75, 90, 105 and 120 storage days. Data are the means from three independent experiments. Bars represent standard deviations.

