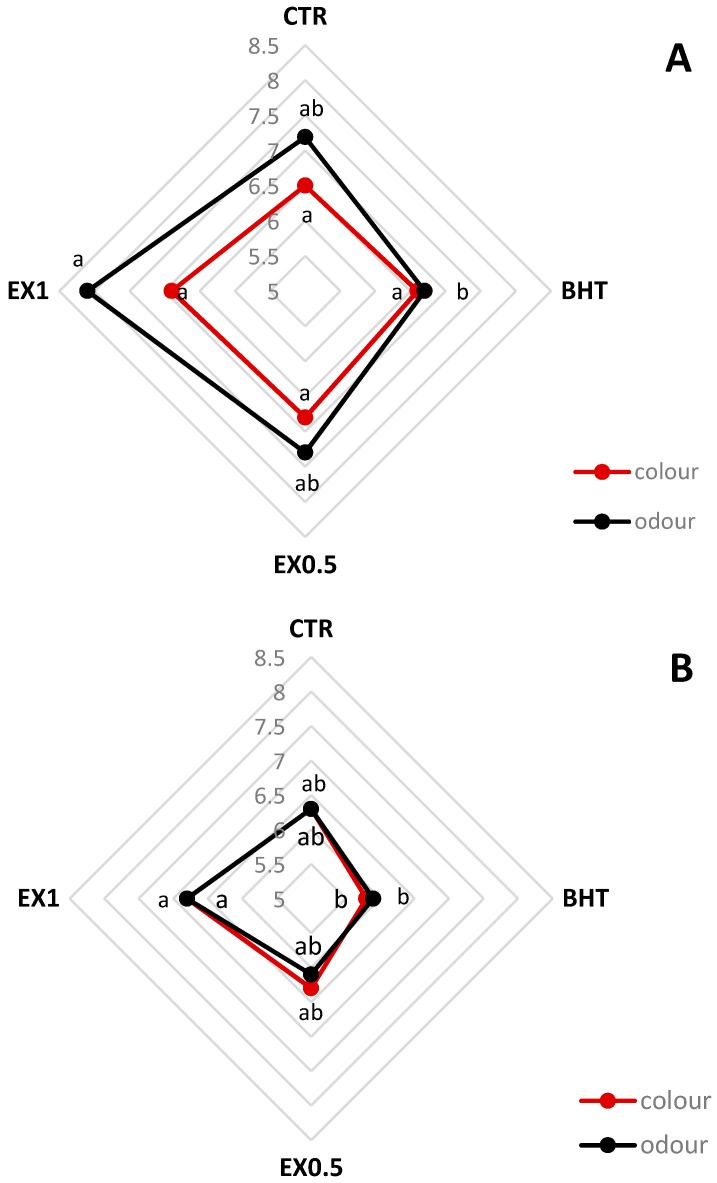
Figure 4.
Results of sensory evaluation at T1 (A) and T90 (B). CTR, control samples; BHT, samples added with the synthetic antioxidant; EX0.5, samples added with olive leaf extract at 0.5 g kg−1; EX1, samples added with olive leaf extract at 1 g kg−1. One-way ANOVA and Tukey’s test were performed among the samples for each time. Different letters indicate significant differences for p < 0.05.

