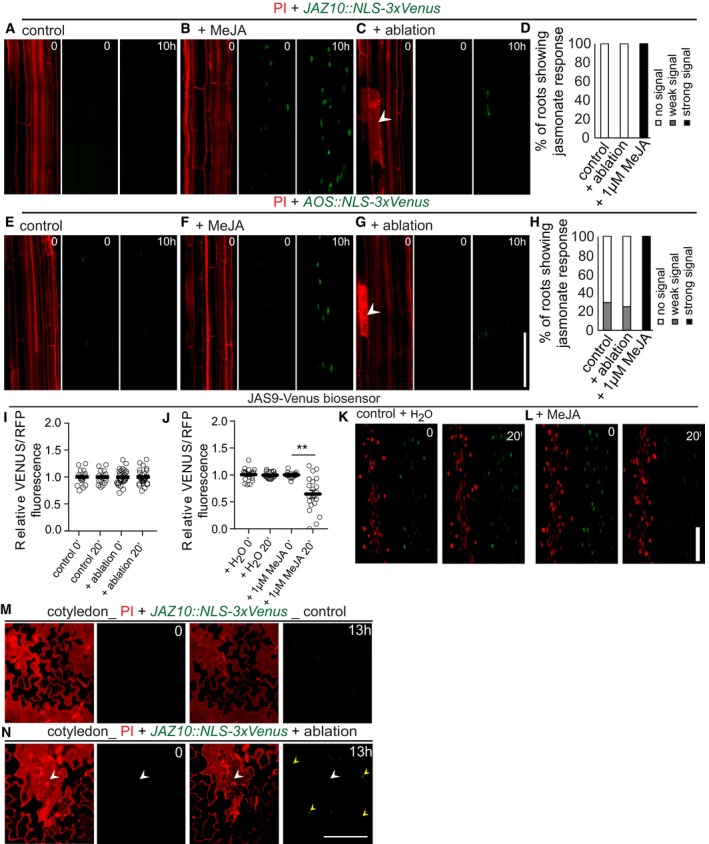
Figure 1. Jasmonate does not respond to single‐cell laser ablation.

-
A–HPropidium iodide (PI) staining of roots (red) allowed visualization of cell death (white arrowhead) by increase in PI fluorescence. (A–C, E–G) Real‐time monitoring of 4D (xyzt) maximum projection images of jasmonate response marker lines JAZ10::NLS‐3xVenus (A–C) and AOS::NLS‐3xVenus (E–G) in the Arabidopsis root after laser ablation of cortex cells (C, G) on 1 μM methyl jasmonate (MeJA) treatment (B, F). Time‐lapse images of representative movies are shown. (A, C) JAZ10::NLS‐3xVenus showed no response, either in control roots or after ablation (n = 20 roots each). (E, G) AOS::NLS‐3xVenus showed weak signals in 5 roots (n = 20) after ablation (G), similar to numbers in non‐ablated controls, where 5 roots (n = 17) showed signals. (B, F) Both jasmonate markers showed responses in roots upon 1 μM MeJA treatment (n = 20). (D, H) Graphical representation of quantification of movies shown in (A–C, E–G), respectively.
-
I–LRatiometric 35S::JAS9‐Venus H2B‐RFP biosensor in the Arabidopsis root before/after laser ablation of cortex cells (I) or treated with 1 μM MeJA (L). No response was observed after 20 min, either in control roots or after ablation, while the sensor responded to treatment with 1 μM MeJA, but not to a water control (J). (K, L) Representative picture of experiments quantified in (J). Graphs combine data from 2 experiments with n = 10 roots (error bars indicate standard error; **P < 0.002, the significance was determined by t‐test).
-
M, NXYZ maximum projection images show the expression of JAZ10::NLS‐3xVenus in PI‐stained Arabidopsis cotyledons before (M) and after ablation (N). Expression of JAZ10::NLS‐3xVenus was observed in 8 cotyledons (n = 9) in ablated and 1 cotyledon (n = 7) in non‐ablated control. A white arrow indicates an ablated epidermal cell, and yellow arrows indicate nuclear JAZ10::NLS‐3xVenus signals. Time points are indicated at the top right corner of each frame.
