-
A, B
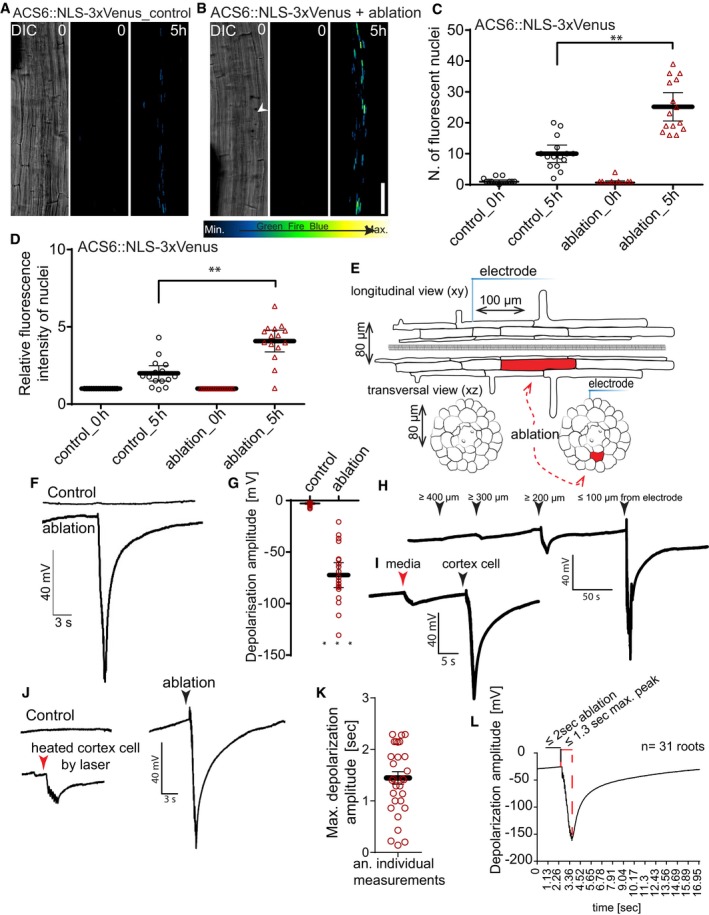
3D tile‐scan (xyz) maximum projection images of ACS6::NLS‐3xVenus ethylene biosynthesis marker line in the Arabidopsis root. Time points at the top right corner of each frame. Non‐ablated control root (A) and root with cortex cell ablation (B). White arrowhead indicates position of ablated cell. Representative pictures of experiments quantified in (C, D).
-
C, D
Laser ablation of single cortex cells induces ethylene biosynthesis marker ACS6 (ACS6::NLS‐3xVenus), visualized as increases of number of cells with detectable nuclear signal (C), or increase in average signal intensity (D) (**P < 0.001, the significance was determined by t‐test, pool of three repeats with n = 5 roots).
-
E
Schematic representation of experimental setup for detecting surface potential changes after laser ablation.
-
F, G
Electrophysiological recording of surface potential changes measured with a non‐invasive electrode placed on the root surface with or without laser ablation of cortex cells. Laser ablation‐induced depolarization, amplitude in mV (G) quantification of depolarization amplitude (***P < 0.0005, the significance was determined by t‐test, pool of three repeats with n = 21 roots).
-
H
Surface potential changes over varying distances of different cortex cells within the same root. Arrowheads indicate the distance of electrode placement from the ablation site.
-
I–L
Average lag time of maximum depolarization after laser ablation (n = 31 roots). (K) Representative read of experiments quantified in (J). Duration of laser pulse indicated by black lines; red lines indicate lag between maximum depolarization and the end of laser pulse. (I, L) Comparison of surface potential changes caused by laser ablation of cortex cells (black arrowheads) with effect of application of the same laser power on (I) media next to the root and (L) on the cortex cell with reduced laser power (red arrowhead).
Data information: Error bars in C, D, G, and K indicate 95% confidence interval (CI) around mean. Scale bar: (A, B) 100 μm. See also Fig
.

