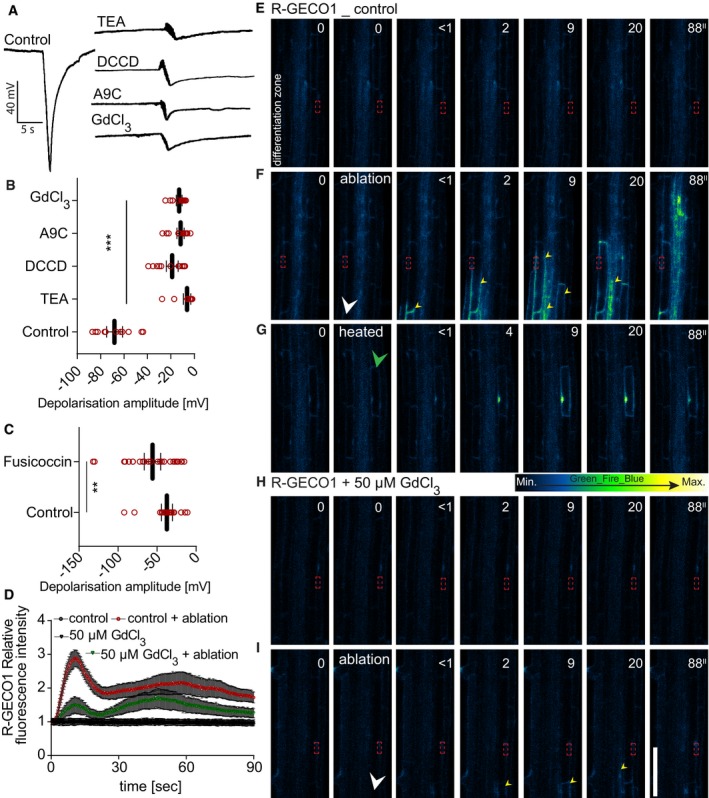
Figure 3. Ion channel inhibitors affect ablation‐induced depolarization and cytosolic calcium increases.

-
A–CRecording and quantification of surface depolarization amplitudes in 5‐day‐old Arabidopsis roots after cortex cell ablation under ion channel inhibitor and fusicoccin treatments. Anthracene‐9‐carboxylic acid (A9C, 50 μM): chloride channel blocker; GdCl3 (50 μM): calcium channel blocker; vanadate (50 μM): non‐specific pump inhibitor; N,N‐dicyclohexylcarbodiimide (DCCD, 50 μM): proton channel blocker, proton pump inhibitor; tetraethylammonium (TEA, 50 μM): potassium channel blocker; (C) fusicoccin (5 μM): proton pump activator; (B, C) quantification of read examples shown in (A) (**P < 0.005, ***P < 0.0005; the significance was determined by t‐test, n = 15–20 roots, repeated three times; error bars indicate mean value with 95% CI).
-
D–IReal‐time monitoring and quantification (D) of calcium wave propagation after cortex cell ablation using a R‐GECO1 reporter line (repeated two times, each with n = 20 roots); error bars indicate standard error, and time‐lapse images of representative movies are shown. (E, F) Comparison of calcium wave caused by laser ablation of cortex cells (F) with effect of reduced laser power (heated) application on the cortex cell (G). (E–I) Time points in seconds (″) at the top right corner of each frame. Signal increases after ablation at opposite root side show slight lag compared to ablated root side. In non‐ablated control roots, no increases of signal were observed; the same applies for 50 μM GdCl3‐treated roots after ablation. White arrowheads indicate ablation position, green arrowhead indicates heated cell, yellow arrowheads indicate calcium wave propagation, and red frame indicates region of signal quantification in (D).
