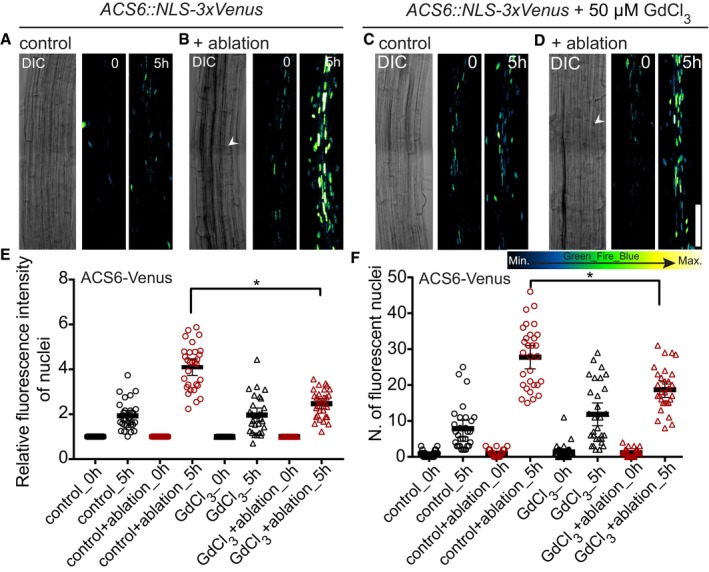
Figure 4. Laser ablation‐induced ethylene responses are partially dependent on calcium increases.

-
A–DXYZ maximum projection images of ACS6::NLS‐3xVenus ethylene biosynthesis marker line in the Arabidopsis root after laser ablation with or without GdCl3 (50 μM). Time points in hours (h) at the top right corner of each frame. White arrowheads indicate position of cortex cell ablation. Representative pictures are shown.
-
E, FSignal intensity quantification and number of cells with positive nuclear (NLS‐3xVenus) signal increases after ablation in control, but increases are reduced upon GdCl3 (50 μM) inhibitor treatment (*P < 0.05, the significance was determined by t‐test, data pooled from three independent experiments with n = 10 roots each; error bars indicate mean value with 95% CI).
