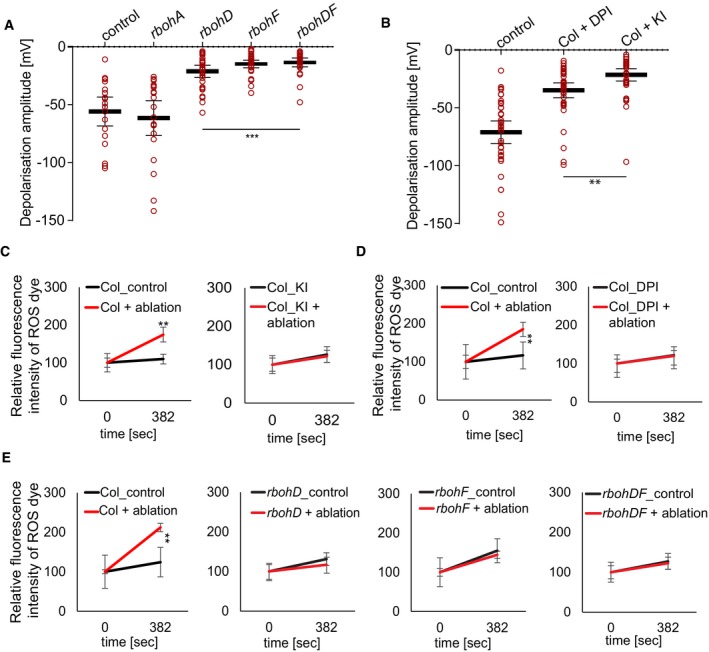
Figure 5. Laser ablation‐induced depolarization and ROS increases require NADPH oxidases.

-
A, BQuantification of surface potential changes after laser ablation of root cortex cells. (A) Quantification of depolarization amplitudes after cortex cell ablation in rbohD, rbohF, and rbohDF mutants, but not in rbohA, compared to control (***P < 0.0005, the significance was determined by t‐test, data pooled from three independent experiments with n = 10 roots each; error bars indicate mean value with 95% CI). (B) Application of ROS production inhibitor diphenyleneiodonium (DPI, 10 μM) and ROS scavenger potassium iodide (KI, 5 mM) significantly reduced depolarization amplitude, compared to non‐treated control (**P < 0.005; the significance was determined by t‐test, data pooled from three independent experiments with n ≥ 10 roots each; error bars indicate mean value with 95% CI).
-
C–EQuantification of ROS production after single‐cell laser ablation. For ROS visualization, 20 μM 2′,7′‐dichlorodihydrofluorescein diacetate (H2DCFDA) was used; representative images are shown in Appendix Fig S4F–Q (**P < 0.005, data pooled from three independent experiments with n = 5 roots each; error bars indicate standard error).
