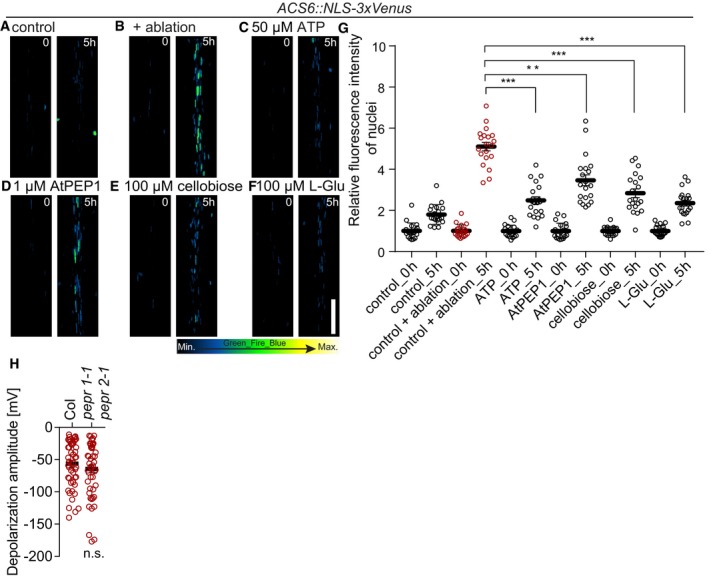
Figure 7. Induction of ACS6 by damage‐associated molecular patterns.

-
A–FXYZ maximum projection images of ACS6::NLS‐3xVenus ethylene biosynthesis marker after laser ablation (B) and upon treatment with ATP (50 μM) (C), AtPEP1 (1 μM) (D), cellobiose (100 μM) (E), and l‐glutamic acid (100 μM) (F). Time points in seconds at the top right corner of each frame. Representative images are shown.
-
GSignal intensity quantification of ACS6::NLS‐3xVenus. Signal intensity increases in all treatments, from time 0 h, but much less when compared to ablation (***P < 0.0001 and **P < 0.001, the significance was determined by t‐test, data pooled from two independent experiments with n = 10 roots each; error bars indicate mean value with 95% CI).
-
HQuantification of depolarization amplitudes after cortex cell ablation were not reduced in pepr1‐1 pepr2‐1 double mutant, compared to wt (Col) (n = 30 roots each; error bars indicate standard error; the significance was determined by t‐test).
