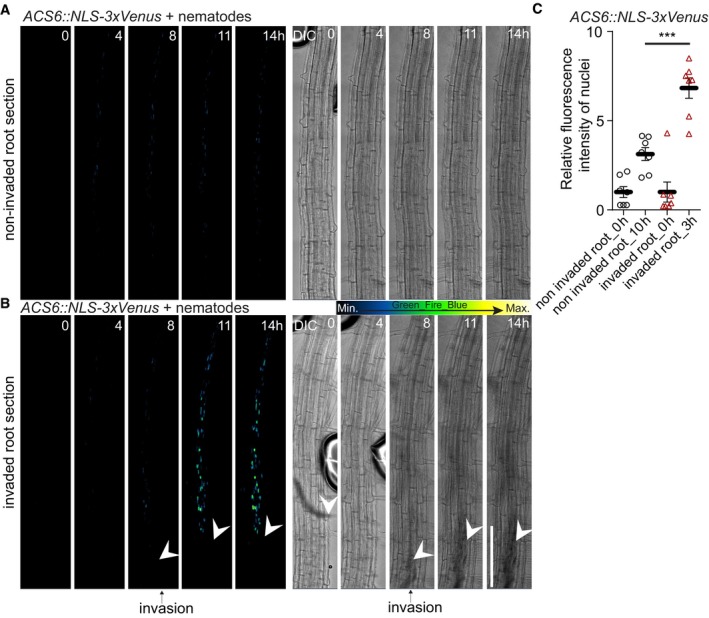
Figure 8. Cyst nematode damage leads to ethylene response.

-
A, BTile‐scan with 4D projection (xyzt) images (A, B) monitoring ethylene biosynthesis by ACS6::NLS‐3xVenus prior to cyst nematode (Heterodera schachtii) infection in 5‐day‐old roots. (A) Control scan demonstrating weak ACS6 response over 14 h in the non‐invaded root section (n = 9). (B) ACS6 expression after nematode intrusion into root tissues (n = 10). White arrowheads indicate position of nematodes, and black arrows indicate time frame when nematode invasion of the root was first observed.
-
CACS6::NLS‐3xVenus ethylene biosynthesis marker line quantification 3 h after nematode intrusion into root tissues (***P < 0.004, the significance was determined by t‐test; error bars indicate standard error, data pooled from three independent experiments).
