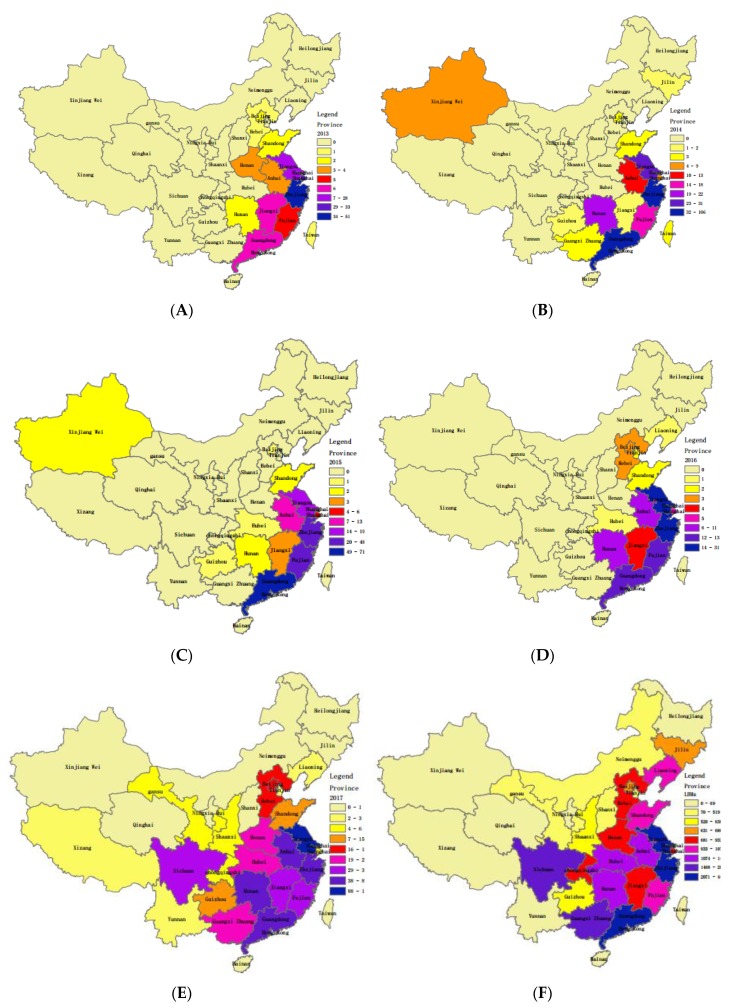
Figure 2.
The map of reported human cases of A(H7N9) prevalence and the number of live poultry markets (LPMs) in China. (A)–(E) Distribution of cumulative numbers of A(H7N9) cases each year from 31 March 2013 to 13 May 2017 in mainland China (including 23 provinces, 4 municipalities, and 5 autonomous regions), Hong Kong, Macao and Taiwan. The number of cases at the region level is reflected by colored gradients, as shown in the legend. (F) Distribution of LPMs for regions in 2017. The map was plotted in ArcGIS 10.2 software (Esri, Redlands, CA, USA).

