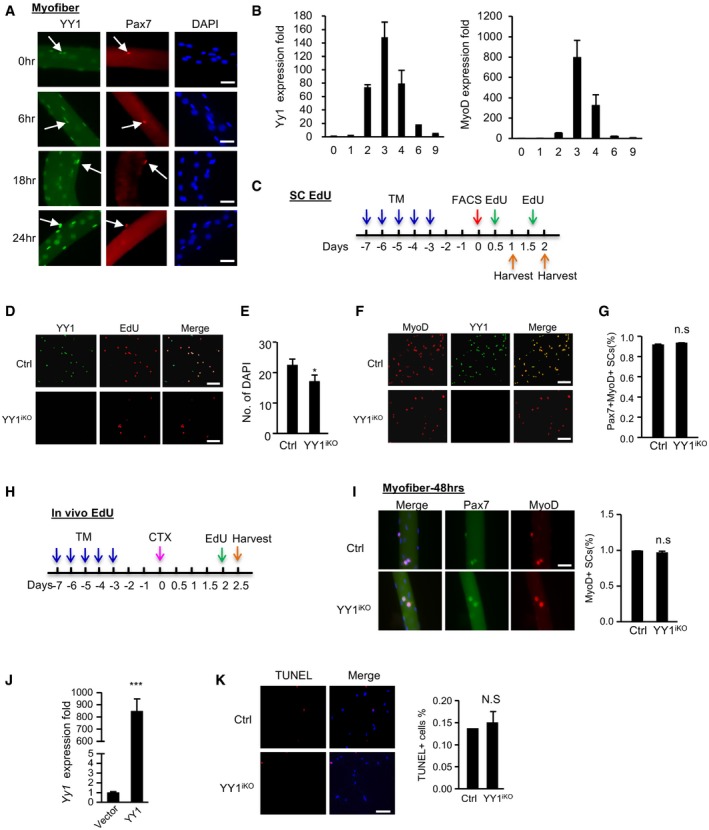
Single myofibers were isolated from EDL muscles and cultured for the designated time (0, 6, 18, or 24 h), followed by immunostaining for Pax7 (red) and YY1 (green). Scale bar = 50 μm. White arrows indicate Pax7+YY1+ cells.
qRT–PCR detection of Yy1 and MyoD mRNA expression level during CTX‐induced muscle regeneration.
Schematic illustration of the in vitro EdU labeling assays. To assess SCs activation, cells were cultured for 12 h and EdU‐labeled for 12 h. To assess the proliferation, cells were cultured for 40 h and labeled for 8 h before harvesting for EdU staining.
As shown in Fig
4C, FACS‐isolated SCs from Ctrl or YY1
iKO mice were cultured for 48 h and EdU‐labeled for 8 h, followed by immunostaining for YY1 (green) and EdU (red) to show. Scale bar = 100 μm.
Quantification of the number of DAPI
+ cells for Fig
4C is shown (
n = 3 mice, each).
FISCs were cultured for 1.5 days and IF‐stained MyoD with YY1. Scale bar = 100 μm.
Quantification of the percentage of Pax7
+MyoD
+ cells in Fig
4E is shown (
n = 3 mice, each).
Schematic illustration of the in vivo EdU labeling assay. Two days after CTX injection, EdU injection via i.p was performed followed by FACS isolation of SCs 12 h later.
Single EDL myofibers were cultured for 48 h in growth media before staining for Pax7 (green) and MyoD (red). Scale bar = 50 μm. The percentage of MyoD+ cells was shown (n = 3 mice, each).
SCs isolated from YY1iKO mice were transfected with a lentiviral YY1‐expressing or empty viruses. The overexpression of YY1 mRNA was detected by RT–qPCR (n = 3, each).
SCs were sorted and cultured for 36 h, followed by TUNEL assay. Quantifications of TUNEL+ cells% are shown on the right (n = 3, each). Scale bar = 100 μm.
Data information: Error bars represent SD's of the mean. Student's
< 0.001.

