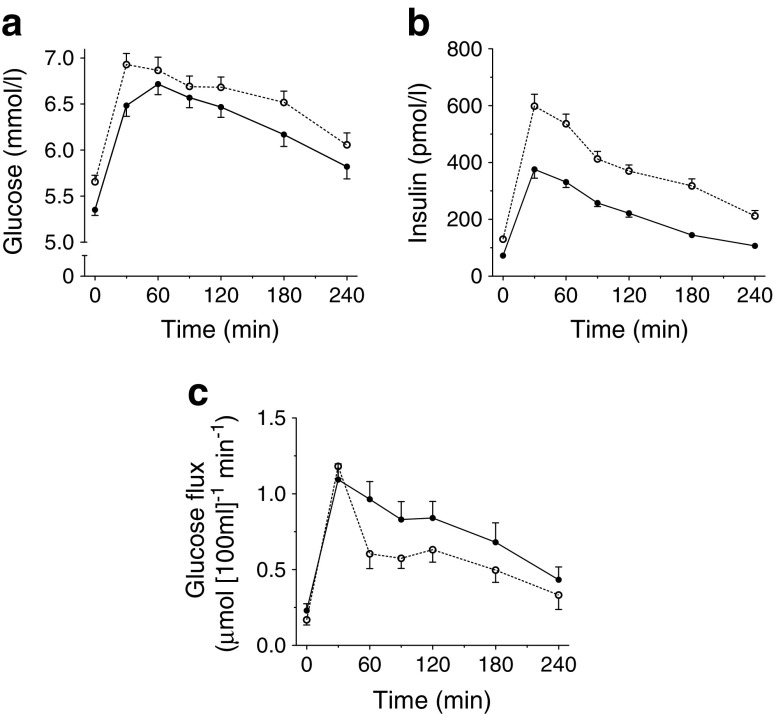
Fig. 1.
Arterialised plasma glucose (a) and insulin (b) concentrations and glucose flux (c) during fasting (0 min) and after consumption of a high-SFA meal. Black circles, mild-IR group; white circles, high-IR group. Student’s t test for unpaired samples showed significant effect of group on fasting and postprandial plasma glucose (p = 0.002 and AUC0-4h: p = 0.035, respectively), fasting and postprandial plasma insulin (p < 0.001 and AUC0-4h: p < 0.001, respectively) and postprandial glucose flux (AUC0-4h: p = 0.034). Values are presented as mean ± SEM

