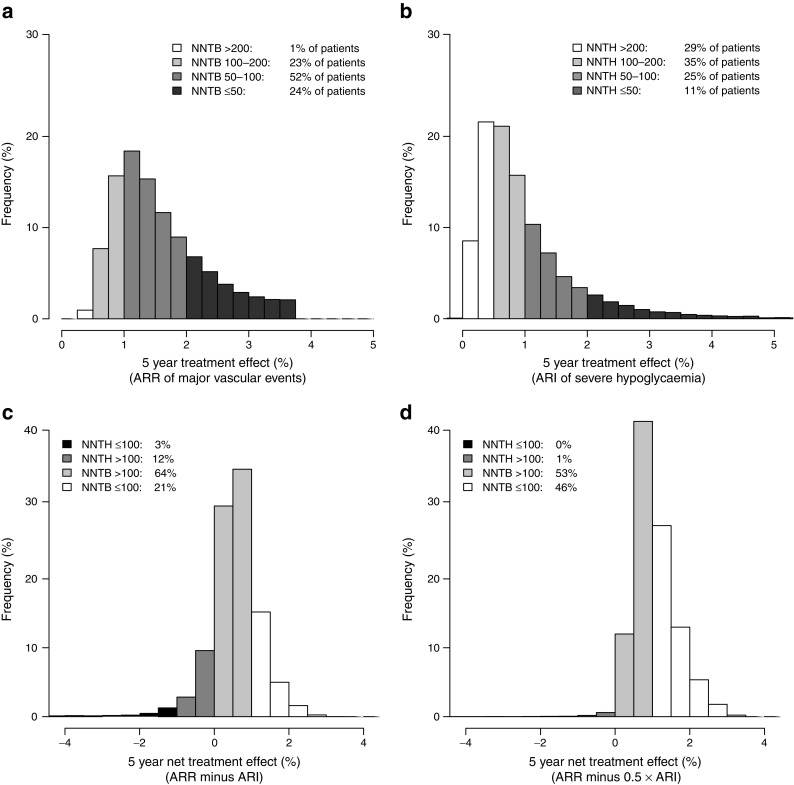
Fig. 3.

Distribution of individual patient treatment effects of intensive glucose control for (a) 5 year ARR for major vascular events and (b) ARI for severe hypoglycaemia, and net treatment effect assigning (c) half the weight or (d) similar weight to severe hypoglycaemia
