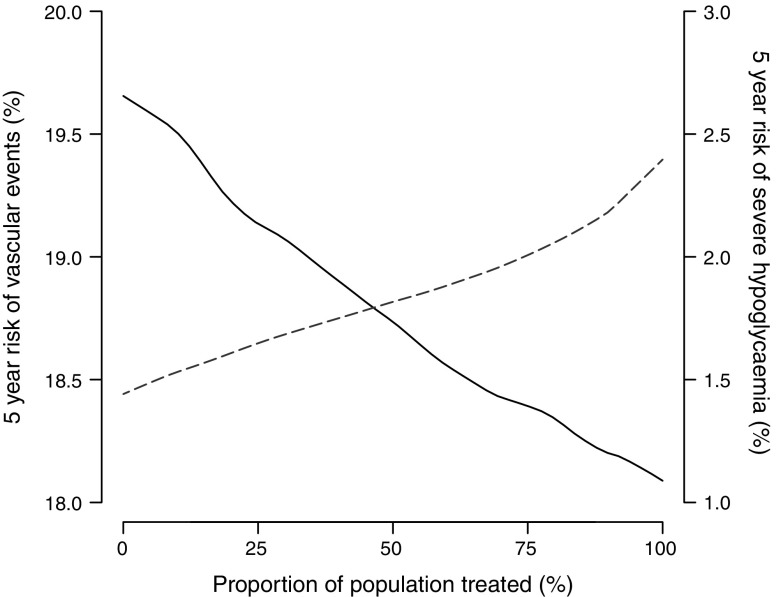
Fig. 4.
Overall effects of selective intensive glucose control treatment on the 5 year incidence of major vascular events and severe hypoglycaemia. The x-axis shows the proportion of patients treated. Patients were ranked according to their estimated net benefit (largest to smallest), e.g. the first 85% of patients had an estimated positive individual net effect. The left y-axis shows the 5 year risk of major vascular events (solid line) and the right y-axis shows the 5 year risk of severe hypoglycaemia (dashed line)

