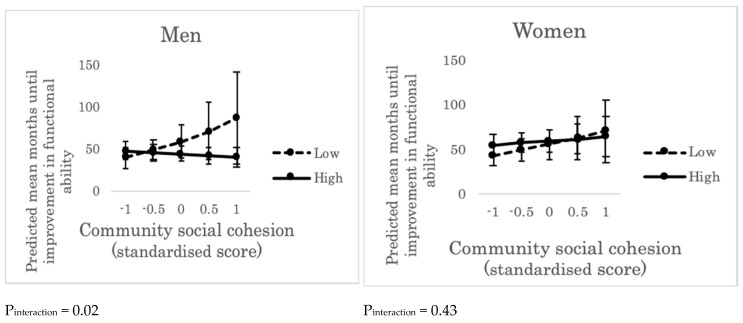
Figure 2.
Predicted mean months until improvement in functional ability across the levels of community social cohesion and the levels of individual perception of community social cohesion (“high” or “low”). Error bars indicate 95% confidence intervals of predicted mean months until improvement in functional ability. Pinteraction represents the p value of cross-level interaction effect (between community social cohesion and individual perception of community social cohesion) on improvement in functional ability, adjusting for individual age, income, education, marital status, living alone, and comorbidity. “High”: people who trusted, perceived others’ intention to help, and/or felt attached to the residential area. “Low”: people who did not trust, did not perceive others’ intention to help, and/or did not feel attached to the residential area.

