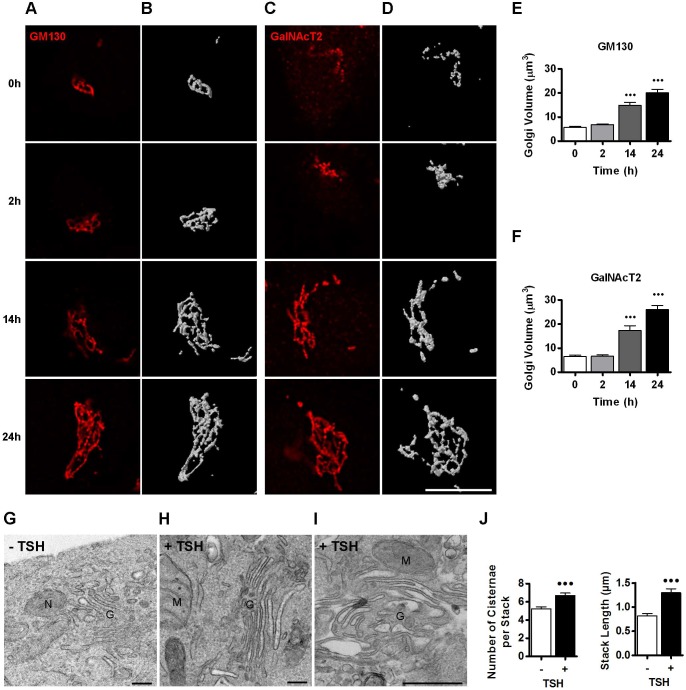
Fig. 3.
TSH stimulation leads to increased Golgi size and volume. (A,C) Deconvolved images obtained from immunofluorescence analysis performed on FRTL-5 cells with antibodies against GM130 (A) and GalNAcT2 (C) at the indicated time points after TSH stimulation. (B,D) Three-dimensional reconstruction of the images shown in A and C, respectively. Scale bar: 10 μm. (E,F) Quantification of Golgi volume normalized to cell size. Cell size was estimated by flow cytometry and the average size of the cell population at 0 h was set as 1. Results are mean±s.e.m. of two independent experiments with 14–17 cells analyzed per condition (•••P<0.001). (G–I) Electron micrographs of FRTL-5 cells incubated under basal (−TSH) conditions (G) or after TSH stimulation (+TSH, 1 mlU/ml) for 24 h (H,I). Images are representative of two independent experiments. N, nucleus; M, mitochondria; G, Golgi. Scale bars: 300 nm. (J) Quantification of number of cisternae within a single stack and stack length for each condition (−TSH or +TSH, 30 stacks were counted in different cells, •••P<0.001, t-test).

