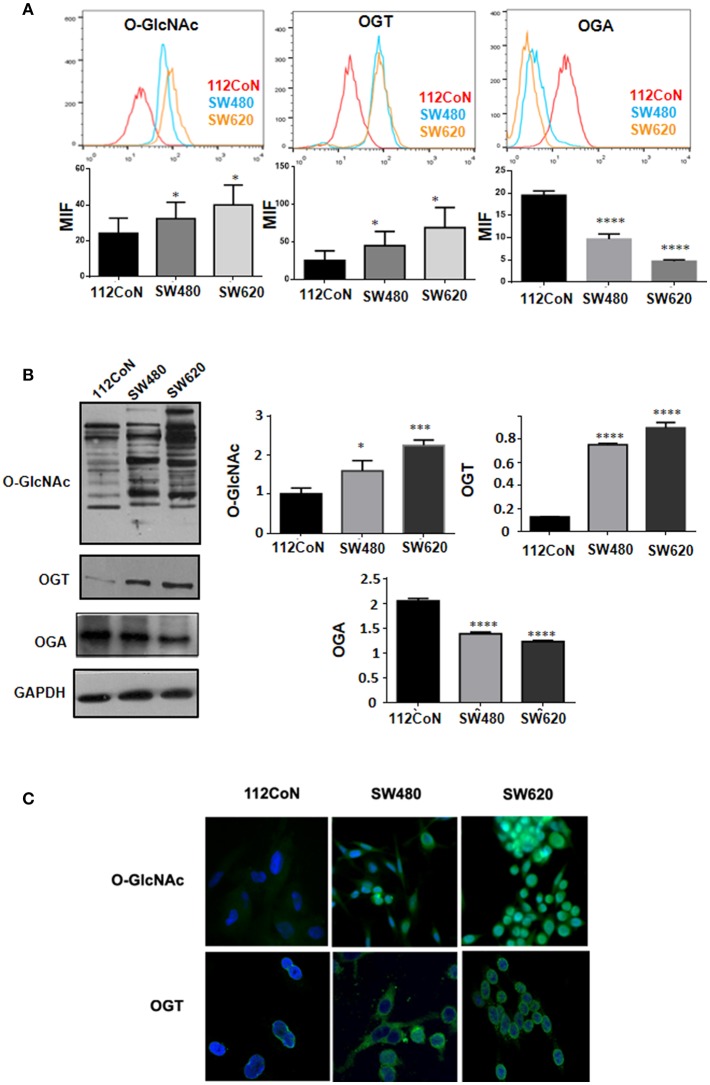
Figure 2.
O-GlcNAcylation levels and OGT expression are higher in colon cancer cell lines compared with normal colon cell line while OGA expression diminished in colon malignant cells compared with non-malignant ones. (A) Flow cytometry. The data represent the means ± SEM from at least three independent assays *p = 0.01; ***p = 0.001; ****p = 0.0001 compared with control 112CoN cells. (B) Western blot and (C) Immunofluoresce assay showing the different levels of O-GlcNAcylation and OGT expression in each cell line. Normal cells: 112CoN, cancer cells: SW480 and SW620.

