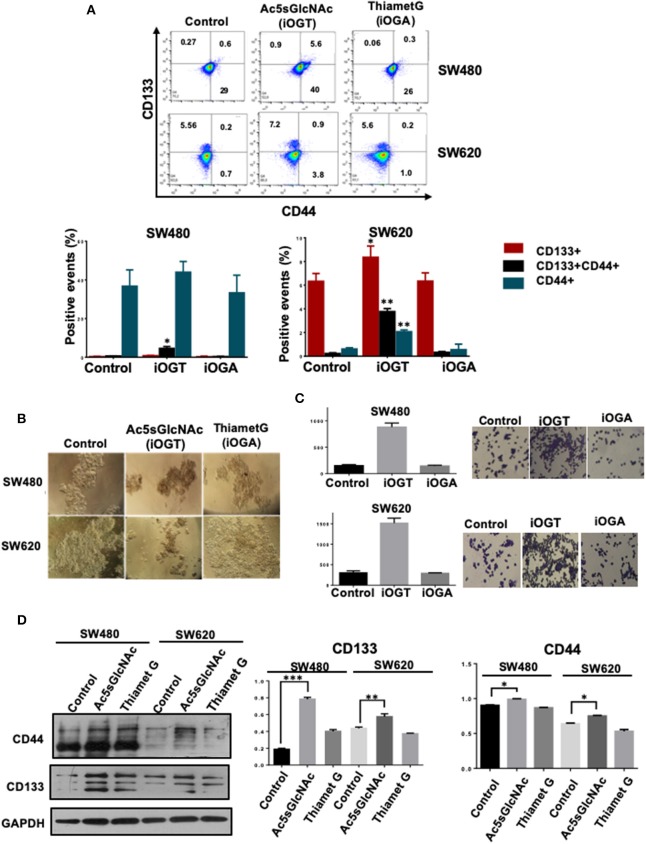
Figure 4.
Inhibition of OGT promoted changes in the expression of CD44+ CD133+ cancer stem cell markers. Cell were incubated 24 h in the absence (DMSO as vehicle) or presence of 50 M Ac5sGlcNAc to decrease the levels of O-GlcNAc, or in the absence (vehicle DMSO) or presence of 1 M Thiamet G to inhibit OGA and increase them. (A) After 24 h of inhibition, expression of CD44+ CD133+ and CD44+CD133+ subpopulations was evaluated by flow cytometry. The data represent the means ± SEM from at least three independent assays *p = 0.01; **p = (t-test) compared with control. (B) Cells Spheroid culture. Total cell populations were cultured in ultra-low adherence six-well plates with medium supplemented with EGF and B27. After 2 weeks of incubation pictures of the spheres were taken. (C) Clonogenicity assay. Cells were cultured in DMEM F12 with ITS in the absence or presence of the OGT or OGA inhibitors to evaluate colony formation. Bar graphs shown represent the mean ± SEM of three independent experiments. (D) Western blot showing the expression of CD133 and CD44 on total cell lysates of the spheroid culture. GAPDH were used as a load control. The results shown are representative of at least three independent experiments using different cell preparations. A densitometric analysis of the expression levels found for each marker is shown at the right and the data represent the means ± SEM from at least three independent experiments. *p = 0.01; **p = 0.005; ***p = 0.001 (t-test) compared with control 112CoN non-malignant cells.

