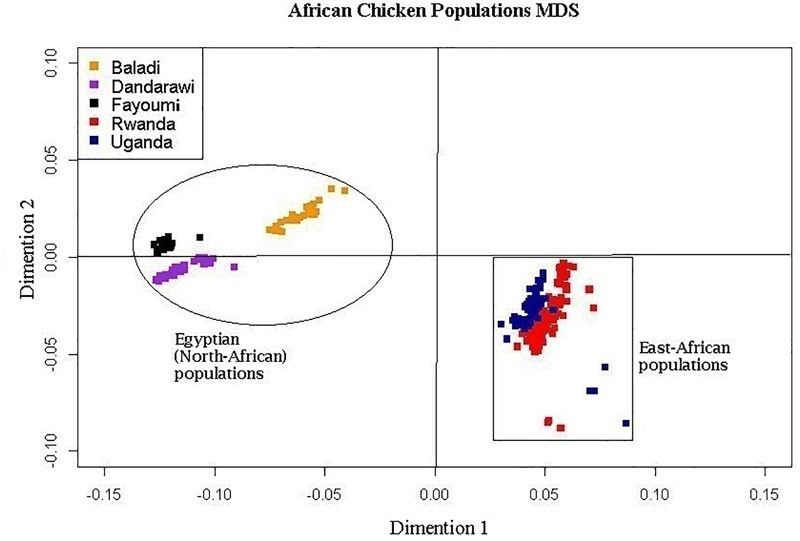
FIGURE 1.

Multi-dimensional scaling, MDS, plot showing the distinct sampled five native African (two East- and three North-African) chicken populations. Plot was constructed based on a matrix of genome-wide Identity-By-State scores calculated based on pairwise comparisons of the genetic distances for all individuals. African chicken populations are Baladi ecotype (N = 31), Dandarawi breed (N = 33), Fayoumi breed (N = 30), Rwanda ecotype (N = 100), and Uganda ecotype (N = 72).
