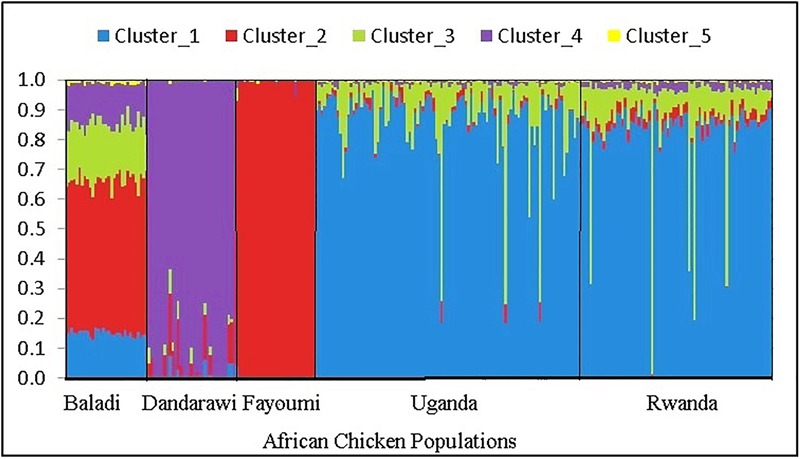
FIGURE 2.

Admixture analysis plot for the five native African chicken populations, based on ancestral model-clustering, with no prior knowledge on breed origins. The optimum number of clusters (ancestral genetic background) k = 5. The five African chicken populations from left to right are three North-African (Baladi; N = 31; Dandarawi, N = 33; and Fayoumi, N = 30) and two East-African (Rwanda, N = 100 and Uganda, N = 72) populations.
