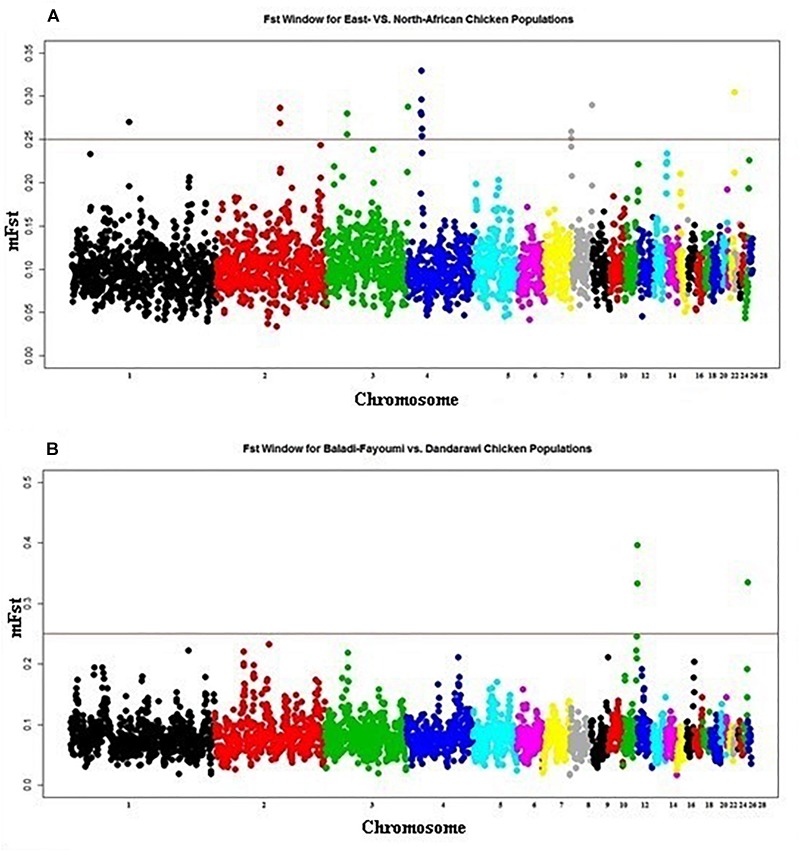
FIGURE 3.

Manhattan plot for the FST analysis of native African chickens populations showing the pairwise comparison of (A) East-African vs. North-African, and (B) Baladi–Fayoumi vs. Dandarawi populations. Plot is set based on mFST (mean FST across overlapping sliding windows). Vertical line presents cut-off threshold of mFST = 0.25, representing very high genetic differentiation.
