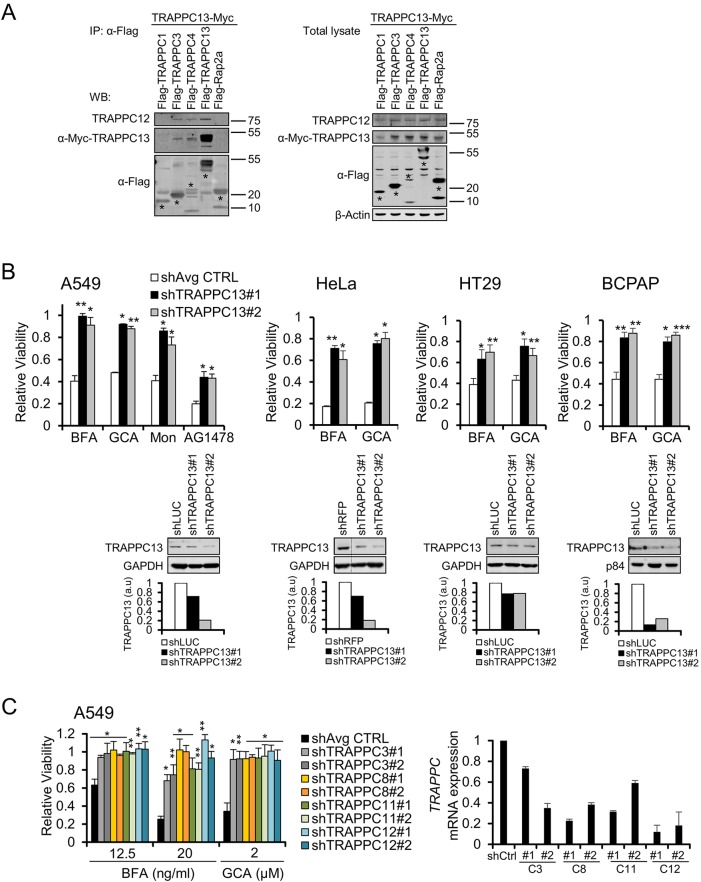
Fig. 1.
Loss of TRAPPC13, a TRAPPC-interacting protein, provides resistance against several Golgi-disrupting agents. (A) TRAPPC13 co-immunoprecipitates TRAPPC3, TRAPPC4, TRAPPC12 and itself. Control and TRAPPC subunits were transiently co-overexpressed in HEK293T cells before Flag IP and western blotting with the indicated antibodies. (B) Viability of several cancer cell lines infected with lentiviral control or TRAPPC13 shRNAs in response to Golgi stress inducers. Relative viability was calculated by dividing fluorescence values (arbitrary units, CTB assay) of BFA-treated cells by their corresponding counterparts under vehicle-treated conditions. The means of TRAPPC13 knockdown and control cells are shown; data are representative of at least three independent experiments. Average controls (shAvg CTRL): the averaged mean survival ratio of one to three control shRNA-infected cell lines (LUC shRNA, RFP shRNA, GFP shRNA); relative viability is shown as mean±s.e.m. Treatment duration, drug concentrations: HeLa: 3 days, 12.5 ng/ml BFA treatment, 2 µM GCA; A549: 3 days 20 ng/ml BFA treatment, 2 µM GCA, 2 µM Mon, 20 µM tyrphostin (AG1478); HT29, BCPAP: 3 days 20 ng/ml BFA treatment, 2 µM GCA; six wells were measured for each genotype and condition. *P<0.05, **P<0.01, ***P<0.001 (two-tailed Student's t-test). Western blot analysis confirmed TRAPPC13 knockdown in the entire cell line panel shown below the viability bar graphs. Quantification of TRAPPC13 levels normalized to GAPDH or p84 are shown; a.u., arbitrary units. (C) Viability of A549 cell lines infected with control or two different hairpins targeting the indicated TRAPPC subunits in response to BFA. Relative viability was calculated as in B. The mean viability values of TRAPPC subunit knockdowns and control cells are shown and are representative of at least three independent experiments. shAvg CTRL: the averaged mean survival ratio of two control shRNA-infected cell lines (LUC shRNA, GFP shRNA); survival ratio is shown as mean±s.e.m. *P<0.05, **P<0.01. Knockdown of TRAPPC3, TRAPPC8, TRAPPC11 and TRAPPC12 transcript levels in A549 cells was confirmed by Q real-time PCR (right graph).

