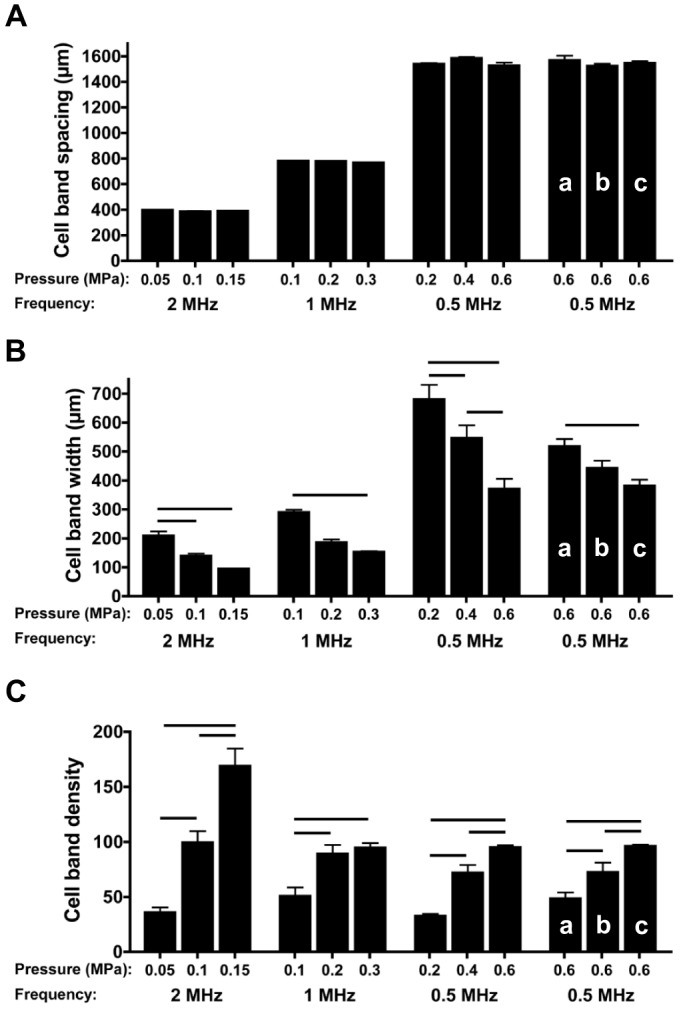
Fig. 3.

Quantification of initial USWF-induced cell patterning in collagen hydrogels. (A–C) As described in Materials and Methods, data from post-processing of B-scan images (shown in Fig. S1) were then used to generate three metrics to quantify USWF-induced cell patterning: cell band spacing (A), cell band width (B) and NAC, i.e., cell band density (C). Cell patterning metrics were obtained for all experimental conditions shown in Fig. 2. Columns labeled a, b and c correspond to cell-seeding concentrations of 0.25×10⁶ cells/ml, 0.5×10⁶ cells/ml and 1×10⁶ cells/ml, respectively. All other data were obtained by using cell-seeding concentrations of 1×10⁶ cells/ml. Data represent mean±s.e.m. (n=4–9). At least three different gels, fabricated on separate days, were analyzed for each parameter examined. Horizontal bars represent statistical significance between groups (ANOVA, Bonferroni post hoc test, P<0.05).
