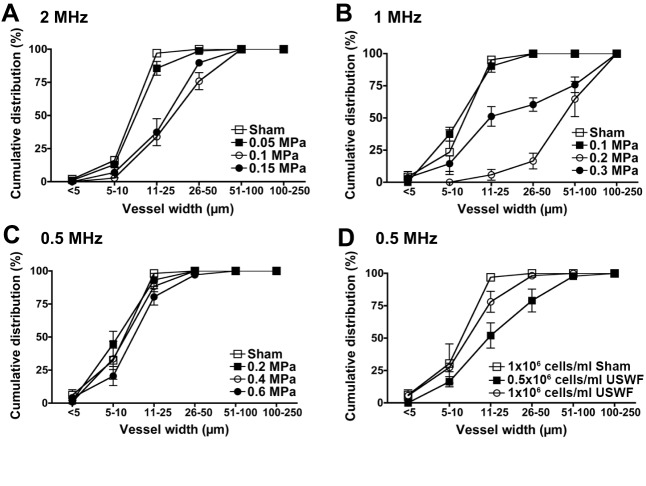
Fig. 5.
Quantification of microvessel cross-sectional widths. (A–D) Light-microscopy images of MTT-stained HUVEC constructs were used to measure cross-sectional widths of microvessels. Cumulative distribution graphs were generated to depict the percentage of vessels with cross-sectional widths less than or equal to each bin size. Data from experiments at 2 MHz (1×10⁶ cells/ml) and pressure amplitudes of 0, 0.05, 0.1 and 0.15 MPa (A). Data from experiments at 1 MHz (1×10⁶ cells/ml) and pressure amplitudes of 0, 0.1, 0.2 and 0.3 MPa (B). Data from experiments at 0.5 MHz (1×10⁶ cells/ml) and pressure amplitudes of 0, 0.2, 0.4 and 0.6 MPa (C). Data from experiments at 0.5 MHz (0.6 MPa) and cell-seeding concentrations of 0.5×10⁶ cells/ml and 1×10⁶ cells/ml (D). Measurements were collected from at least three images of four to nine samples per condition. Samples were fabricated in at least three independent experiments. Data are presented as mean±s.e.m. for the samples within each condition.

