Fig. 7.
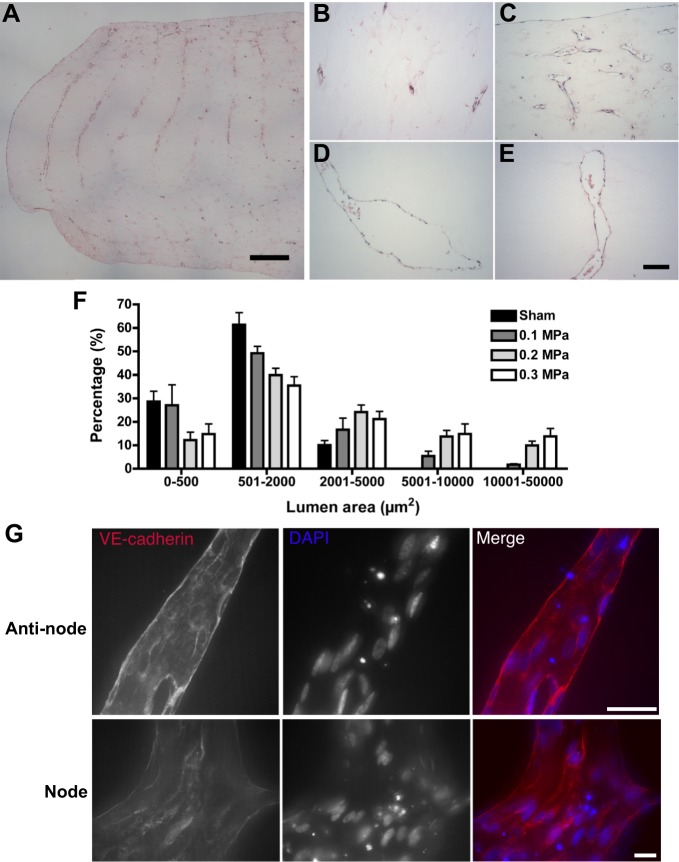
Histological assessment of microvessel networks and quantification of microvessel lumen areas. (A–F) HUVEC microvessel constructs were fixed and sectioned through the center of the gel and stained with hematoxylin and eosin (A–E). Sections were imaged using light microscopy and lumen area was quantified using ImageJ software (F). Panel A is a representative image of a day-10 construct initially patterned by using 1-MHz USWF and 0.1 MPa pressure amplitude; scale bar: 500 µm. Higher magnification images of gels patterned using 1-MHz USWFs with 0 (B), 0.1 (C), 0.2 (D) and 0.3 (E) MPa pressure amplitudes are shown; scale bar: 100 µm. (F) Lumen areas were quantified as a function of pressure amplitude and displayed as a histogram. Data are presented as mean±s.e.m. of five sections with at least 25 non-overlapping images, obtained from each of two independent gels per condition. VE-cadherin was visualized in cell–cell junctions by using a rabbit polyclonal anti-VE-cadherin antibody (red). Cell nuclei were visualized with DAPI (blue). (G) Representative images obtained from both anti-nodal and nodal regions of day-10 constructs initially patterned using 1 MHz, 0.3 MPa. Scale bars: 20 µm.

