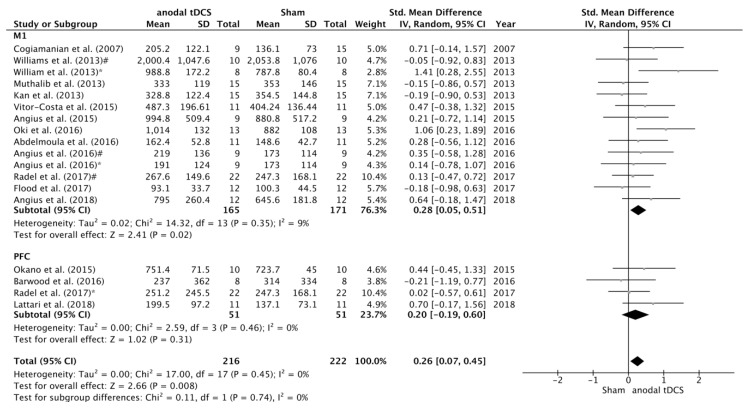
Figure 4.
Forest plot of the subgroup analysis for the comparison of the TTF between anodal tDCS over M1 versus PFC. Williams et al. [17] *—subgroup that received full time anodal tDCS during the task (i.e., submaximal isometric elbow contraction until failure). Williams et al. [17] #—subgroup that received part time anodal tDCS during the task (i.e., submaximal isometric elbow contraction until failure). Angius et al. [27] *—condition in which the subjects received anodal tDCS using a cephalic montage (Anode in M1 and Cathode in right DLPFC). Angius et al. [27] #—condition in which the subjects received anodal tDCS using an extracephalic montage (Anode in M1 and Cathode in shoulder). Radel et al. [16] *—condition in which the subjects received anodal tDCS over the PFC. Radel et al. [16] #—condition in which the subjects received anodal tDCS over the PFC.

