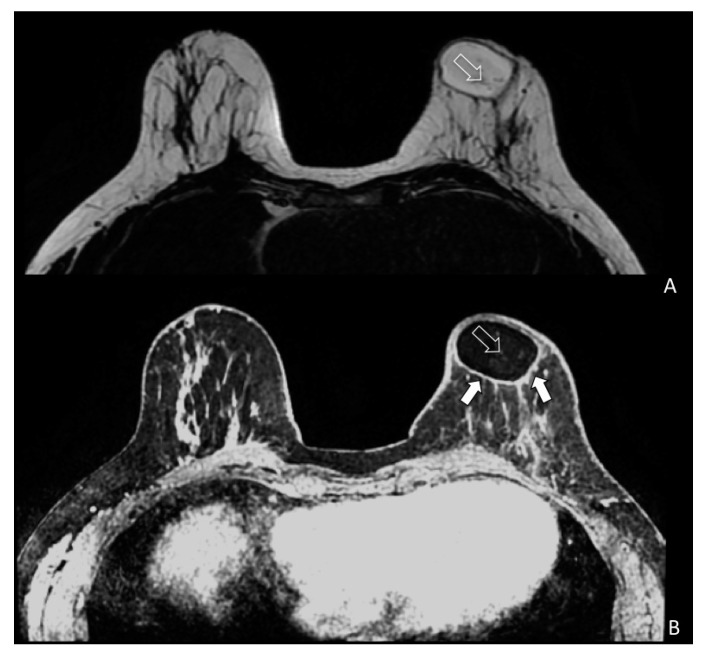
Figure 5.
Magnetic resonance imaging (MRI) of a patient (SG) treated with EF-e-A. (A) Axial MRI T2-weighted turbo spin echo image of both breasts. Fat is imaged with hyper-intense signal and glandular tissue with the matrix is characterized by hypo-intense signal. In the left breast is showed an oval area of hyper-intense signal representing the fat grafting. Very small vessels are depicted in the area (white empty arrow); (B) Bilateral three-dimensional T1-weighted spoiled turbo gradient echo image after contrast media administration VIBRANT sequence showed contrast uptake of the glandular tissue and of the fat graft boundary (white arrows). In this sequence, fat graft is characterized by hypo-intense signal due to the fat saturation pulse. In the fat graft, small vessels characterized by contrast media uptake are confirmed (white empty arrow).

