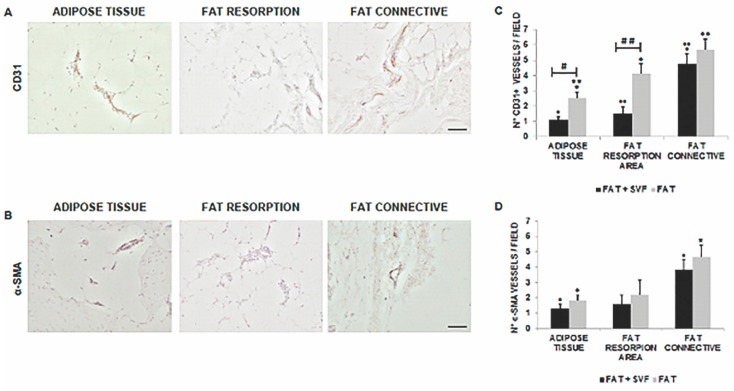
Figure 8.
(A,B) displayed representative 100× magnification images of AT, fat reabsorption area and CT stained for CD31 (brown color; DAB as chromogen) and α-SMA (black color; DAB-Nickel as chromogen) within a mastectomy flap biopsy. (C,D) show the results of comparison between the two groups. The statistical symbols *, **; •, •• and #, ##, indicate the maximum value and differences between study and control group. *, • are maximum values; **, •• are two values above the limit; # indicate marked difference between the study group and the control group; ## very marked difference between the study group and the control group.

