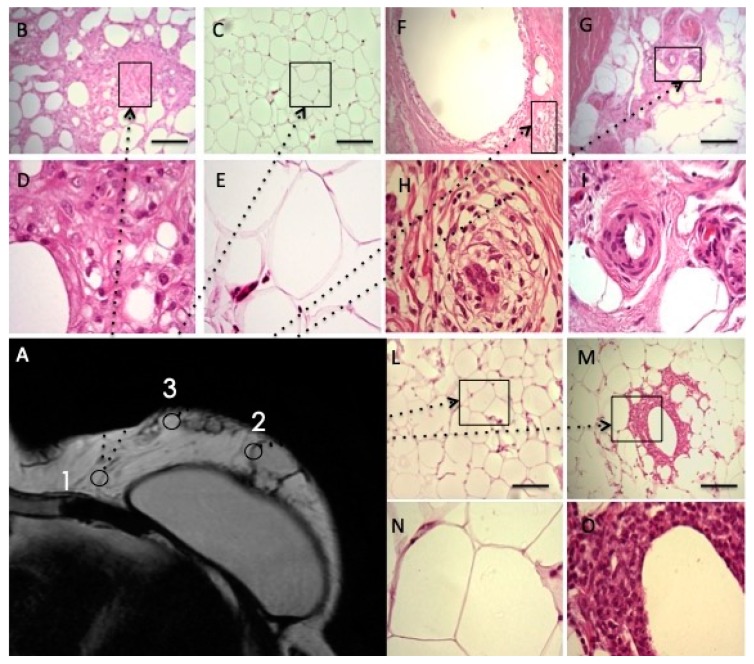
Figure 9.
Biopsies analyses, one year later, the enhanced fat graft’s injection. (A) MRI image. The point 1 show the biopsy site, harvested on fat graft performed into inner quadrant of the breast close to the chest wall. Histological analysis of the biopsy reported in Images (B–E) as Hematoxylin and Eosin stained sections (100× magnification and inset 400×) showed tissue that was characterized by round shaped adipocyte without any abnormality. Normal fat tissue and adipocytes were indicated by arrows. The point 2 show the biopsy site, harvested on fat graft performed into more outer quadrant of the breast. Histological analyses of the biopsy, as reported in Images (L–O) as Hematoxylin and Eosin stained sections (100× magnification and inset 400×), have reported fibrotic tissue substitution with neo-vascularized regenerative fat (arrow). Therapeutic angiogenesis at the regenerative margin was showed (arrow). The point 3 show the biopsy site, harvested on fat graft performed into medial-outer quadrant of the breast. Histological analysis of the biopsy reported in Images (F–I) as Hematoxylin and Eosin stained sections (100× magnification and inset 400×) showed fibrotic partially remodeled tissue (arrow). Poor neo-angiogenesis with the persistence of remodeling areas was also reported (arrow). Regenerative process “in progress”.

