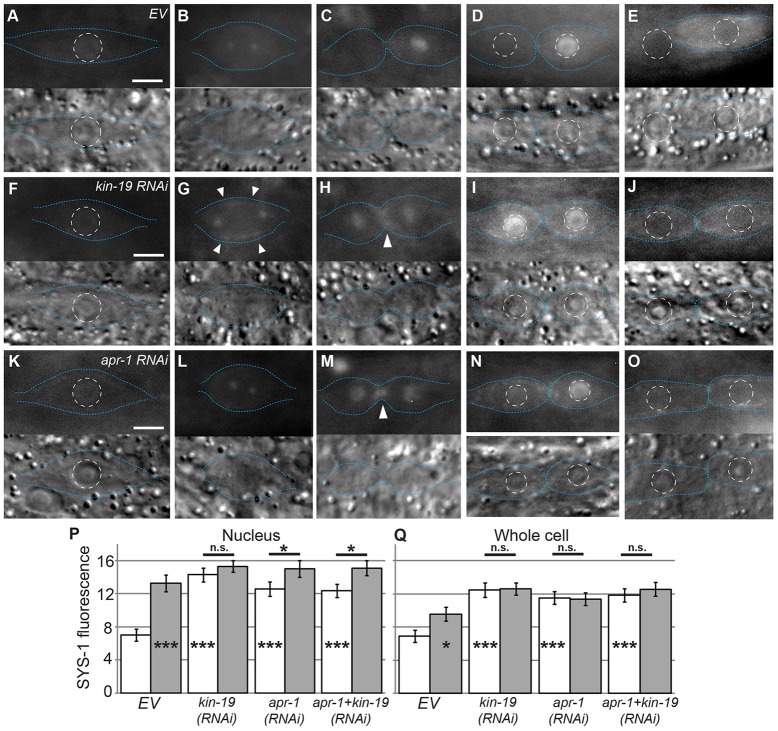
Fig. 2.
KIN-19 and APR-1 are required for asymmetric localization of SYS-1 during seam cell division. (A–E) YFP::SYS-1 localization in wild-type/empty feeding vector (EV) seam cells. (F–J) YFP::SYS-1 localization in kin-19(RNAi) cells. (K–O) YFP::SYS-1 localization in apr-1(RNAi) cells. In A–O, the upper images display YFP::SYS-1 and the lower images display the corresponding DIC images. Blue dotted lines, cell boundaries; white dashed circles, nuclear boundaries. Scale bars: 5 µm. (A,F,K) Prior to division, SYS-1 localizes to the cortex and nucleus. (B,G,L) During metaphase, SYS-1 localizes to centrosomes in all cells and to the cortex in kin-19(RNAi) cells (arrowheads). (C,H,M) Early telophase. In empty-vector controls, SYS-1 localizes asymmetrically to the nuclear regions of the dividing cell. In kin-19(RNAi) and apr-1(RNAi) cells, SYS-1 localizes symmetrically to the nuclear regions. Arrowheads, cortical SYS-1 localization. (D,I,N) Late telophase. SYS-1 levels in empty-vector control nuclei remain asymmetric. SYS-1 levels in the nuclei of kin-19(RNAi) cells remain symmetric. In apr-1(RNAi) cells, nuclear levels of SYS-1 become asymmetric, although nuclear levels of SYS-1 in anterior daughters remain higher than those of empty-vector controls. (E,J,O) 1 hour post-division. In controls, the anterior daughter has fused to hyp7. In kin-19(RNAi) and apr-1(RNAi) cells, both daughters have adopted the seam fate. (P,Q) The average nuclear (P) and whole-cell (Q) YFP::SYS-1 fluorescence intensity after telophase. White bars, anterior daughters; gray bars, posterior daughters. The n values are as follows: EV, n = 41; kin-19(RNAi), n = 28; apr-1(RNAi), n = 32; apr-1+kin-19(RNAi), n = 22. Data show the mean±s.e.m.; *P<0.05; ***P<0.001; n.s.P>0.05. Asterisks inside columns are a comparison to anterior empty-vector control.

