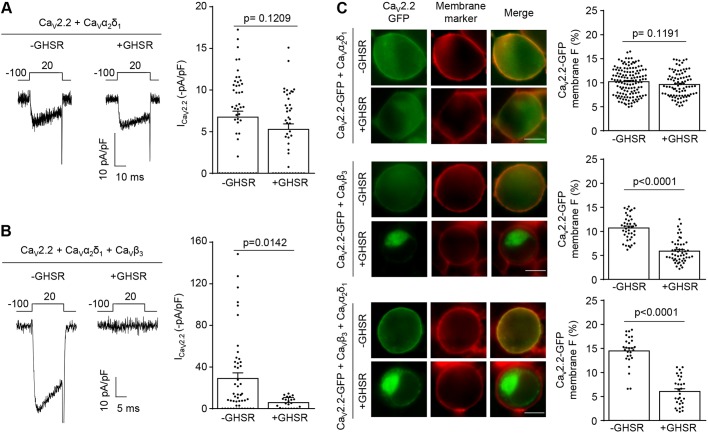
Fig. 4.
Presence of CaVβ3 but not that of CaVα2δ1 is required for GHSR constitutive activity to reduce CaV2.2 current by decreasing CaV2.2 density on plasma membrane. (A) Representative CaV currents from tsA201 cells co-transfected with CaV2.2, CaVα2δ1 and GHSR (+GHSR, n=44) or from controls transfected with empty plasmid (-GHSR, n=51) and average ICa for each condition. (B) Representative CaV currents from tsA201 cells co-transfected with CaV2.2, CaVβ3, CaVα2δ1 and GHSR (+GHSR, n=22) or empty plasmid (-GHSR, 48) and average ICa for each condition. (C) Photomicrographs and averaged GFP plasma membrane signal (in percent) of tsA201 cells co-transfected with CaV2.2-GFP, CaVα2δ1 and GHSR (+GHSR, n=87) and from controls transfected with empty plasmid (-GHSR, n=135) (top). Photomicrographs and average of GFP plasma membrane signal (in percent) of tsA201 cells co-transfected with CaV2.2-GFP, CaVβ3 and GHSR (+GHSR, n=51) or from controls transfected with empty plasmid (-GHSR, n=42) (middle). Photomicrographs and average of GFP plasma membrane signal (in percent) of tsA201 cells co-transfected with CaV2.2-GFP, CaVβ3, CaVα2δ1 and GHSR (+GHSR, n=29) or from controls transfected with empty plasmid (-GHSR, n=27) (bottom). Green and red signals correspond to the eGFP tag on CaV2.2 and the membrane marker CellMask, respectively. Scale bars: 10 µm. Error bars represent mean±s.e.m. and individual points represent each cell analyzed. Mann–Whitney test.

