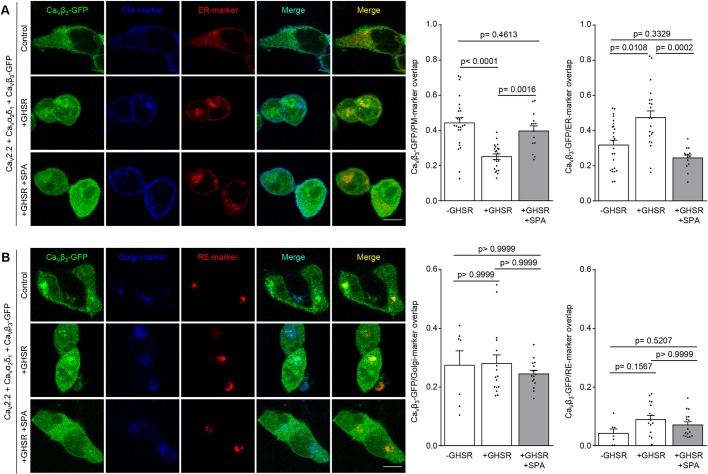
Fig. 6.
GHSR constitutive activity reduces CaVβ3 density on the plasma membrane while increasing it on the ER. (A) Confocal images of tsA201 cells co-transfected with CaV2.2, CaVβ3-eGFP, CaVα2δ1, plasma membrane marker (PM-marker), endoplasmic reticulum-marker (ER-marker) and GHSR pre-incubated with SPA (1 µM) (+GHSR+SPA, n=14) or not (+GHSR, n=21) and of controls transfected with empty plasmid (-GHSR, n=25). (B) Confocal images of tsA201 cells co-transfected with CaV2.2, CaVβ3-eGFP, CaVα2δ1, Golgi marker (Golgi-marker), recycling endosome marker (RE-marker) and GHSR pre-incubated with SPA (1 µM) (+GHSR+SPA, n=16) or not (+GHSR, n=16) and of controls transfected with empty plasmid (-GHSR, n=7). Bar graphs show the colocalization of green signal from CaVβ3-eGFP with blue signal (from PM-marker or Golgi-marker) or with red signal (from ER-marker or RE-marker). Scale bars:10 µm. Error bars represent mean±s.e.m., individual points represent each quantified cell. One way-ANOVA with Turkey's post-test (F2, 57=16.43) (CaVβ3-eGFP/PM-marker overlap) and Kruskal–Wallis with Dunn's post-test.

