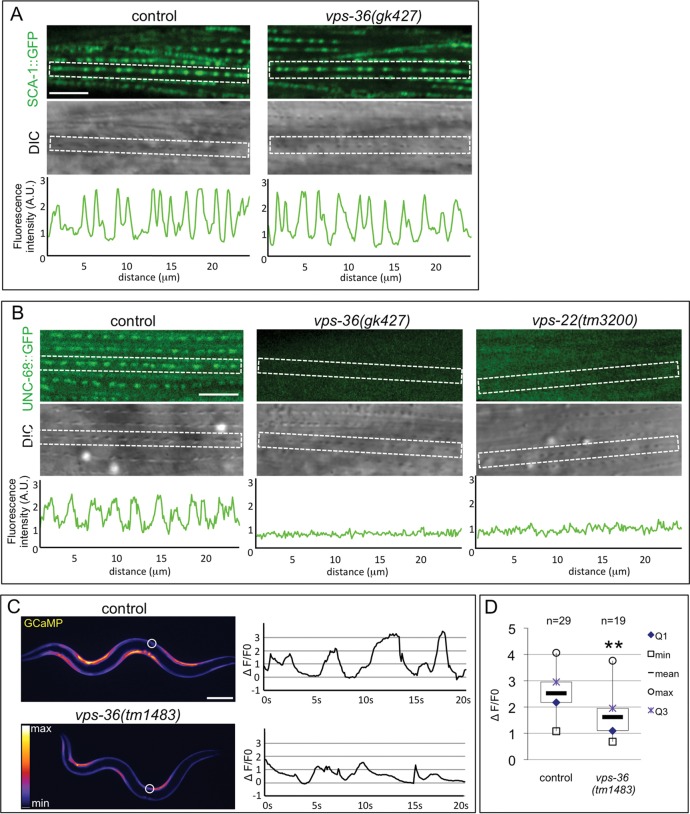
Fig. 5.
UNC-68 localization to the sarcoplasmic reticulum and Ca2+ dynamics are altered in vps-36 mutant. (A) Confocal image (upper panel) and the corresponding DIC picture (lower panel) of vps-36 mutants expressing SCA-1::GFP. Graphs represent the fluorescence intensity measured in the dotted rectangle. Scale bar: 5 µm. (B) Confocal image (upper panel) and the corresponding DIC picture (lower panel) of control, vps-36 and vps-22 mutants expressing UNC-68::GFP. Graphs represent the fluorescence intensity measured in the dotted rectangle. Scale bar: 5 µm. (C) In vivo analysis of transgenic worms expressing the GCaMP3.35 Ca2+ biosensor indicator in BWM cells. Representative images and fluorescence records plotted as ΔF/F0 for the indicated region of interest (white circle) of control and vps-36 mutant animals expressing GCaMP3.35. The bright signal in BWM cells indicates the Ca2+ intensities. Scale bar: 100 µm. (D) Boxplots of ΔF/F0 peak values associated with muscle contractions obtained from control and vps-36 animals during the 20 s acquisition time. n values represent the number of peaks. ** indicates a statistically significant difference between mutant and control animals by a Mann–Whitney-Wilcoxon test (P<0.001).

