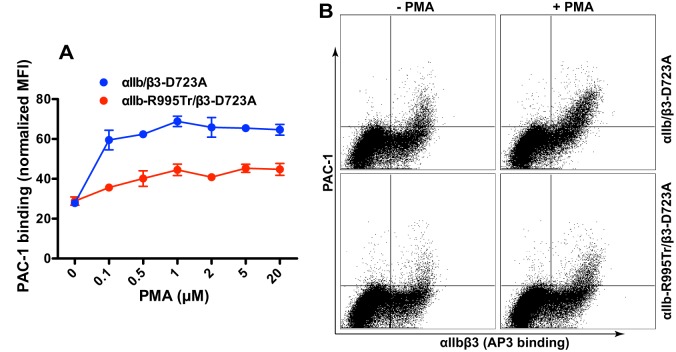
Fig. 4.
The αIIb CT MD region is required for PMA-stimulated integrin activation in K562 cells. (A) Dose–response curve for PMA-induced PAC-1 binding to αIIbβ3 integrin expressed in K562 cells. Transfected K562 cells were incubated with PMA and then with PAC-1. Flow cytometry was used to measure PAC-1 binding. Data are presented as the MFI of the ligand normalized to integrin expression. Data are presented as mean±s.e.m (n=4). (B) Representative flow cytometry plots of PMA-induced (at 1♣∀M) PAC-1 binding to K562 cells expressing the indicated αIIbβ3 integrins.

