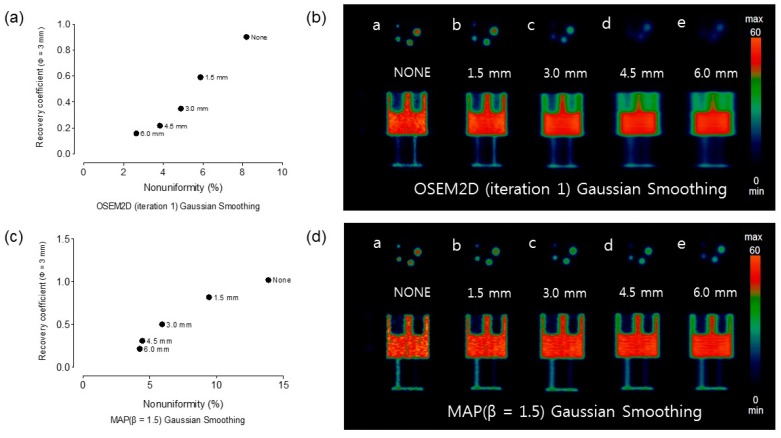
Figure A2.
RC and NU of OSEM2D (iteration 1) and OSEM3D-MAP (β = 1.5) data with application of Gaussian smoothing kernel. Applied Gaussian FWHM was 1.5 mm, 3.0 mm, 4.5 mm, and 6.0 mm, respectively. (a) Plot of NU vs. RC (rod diameter, 3 mm) for OSEM2D (iteration 1), (b) representative PET data, (c) plot of NU vs. RC (rod diameter, 3 mm) for OSEM3D-MAP (β = 1.5), and (d) representative PET data. MAP: OSEM3D-MAP.

