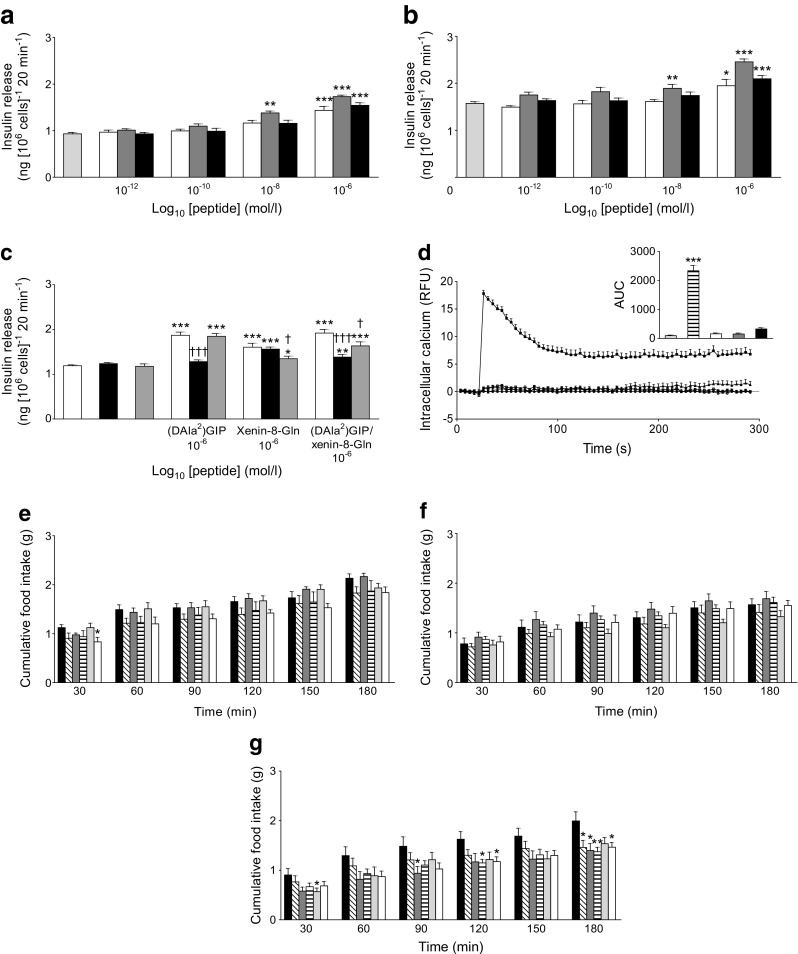
Fig. 1.

Effects of peptides on insulin release and intracellular Ca2+ concentrations in BRIN-BD11 cells and on cumulative food intake in lean control mice. (a, b) BRIN-BD11 cells were incubated (20 min) with test peptides in the presence of 5.6 mmol/l glucose (a) or 16.7 mmol/l glucose (b). Light-grey bars, glucose controls; white bars, xenin-8-Gln; dark-grey bars, (DAla2)GIP; black bars, (DAla2)GIP/xenin-8-Gln. (c) Effects of the GIP and neurotensin receptor antagonists, GIP(6-30)Cex-K40[Pal] and SR142948A, respectively, on (DAla2)GIP-, xenin-8-Gln- and (DAla2)GIP/xenin-8-Gln-mediated (20 min) insulin release in BRIN-BD11 cells. White bars, incubation in 5.6 mmol/l glucose alone; black bars, glucose plus GIP(6-30)Cex-K40[Pal] (10−6 mol/l); grey bars, glucose plus SR142948A (10−6 mol/l). (d) BRIN-BD11 cells were incubated with 5.6 mmol/l glucose in the presence of test peptides (10−6 mol/l) and intracellular Ca2+ concentrations were assessed over a 5 min period, with alanine (10 mmol/l) as positive control. AUC (0–300 s) data is shown in the inset. Black circles and light-grey bars, 5.6 mmol/l glucose control; black squares and striped bars, 10 mmol/l alanine; white circles and white bars, xenin-8-Gln; white squares and dark-grey bars, (DAla2)GIP; black triangles and black bars, (DAla2)GIP/xenin-8-Gln. (e–g) Cumulative food intake was measured after i.p. injection of peptides at 25 (e), 100 (f) and 250 nmol/kg (g) in overnight-fasted (18 h) lean control mice. Black bars, saline control; diagonally striped bars, xenin-8; dark-grey bars, xenin-25; horizontally striped bars, xenin-8-Gln; light-grey bars, (DAla2)GIP; white bars, (DAla2)GIP/xenin-8-Gln. Values represent means ± SEM (n = 8). *p < 0.05, **p < 0.01 and ***p < 0.001 compared with respective glucose (a–d) or saline controls (e–g); † p < 0.05 and ††† p < 0.001 compared with incubations in the absence of GIP or neurotensin receptor antagonists, as appropriate
