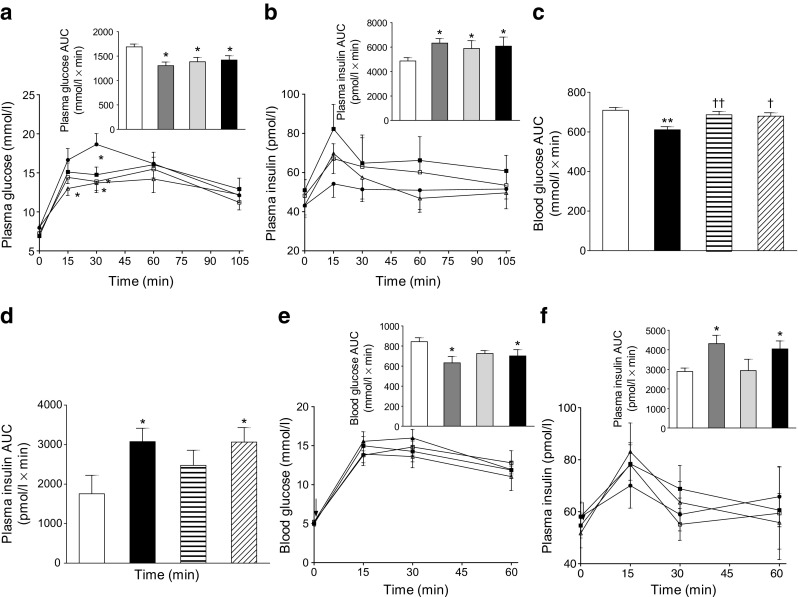
Fig. 2.

Acute and persistent glucose-lowering and insulin-releasing effects of (DAla2)GIP, xenin-8-Gln and (DAla2)GIP/xenin-8-Gln in lean control mice. (a, b) Blood glucose (a) and plasma insulin (b) concentrations were measured before and after i.p. injection of glucose alone (18 mmol/kg) or in combination with peptides (each at 25 nmol/kg) in non-fasted mice. AUCs are shown in insets. (c, d) Overall AUCs for blood glucose (c) and plasma insulin (d) were measured before and after i.p. injection of (DAla2)GIP/xenin-8-Gln. (25 nmol/kg) in combination with glucose (18 mmol/kg) in the absence or presence of GIP(6-30)Cex-K40[Pal] and SR142948A (both at 25 nmol/kg) in non-fasted mice. (e, f) Blood glucose (e) and plasma insulin (f) concentrations were measured following an i.p. glucose load (18 mmol/kg) in non-fasted mice injected with saline vehicle or peptides (each at 25 nmol/kg) 4 h previously. AUCs are shown in insets. Black circles and white bars, glucose alone (a–d) or saline control (e, f); white triangles and dark-grey bars, glucose (a, b) or saline (e, f) in combination with (DAla2)GIP; white squares and light-grey bars, glucose (a, b) or saline (e, f) in combination with xenin-8-Gln; black squares and black bars, glucose (a–d) or saline (c, d) in combination with (DAla2)GIP/xenin-8-Gln; horizontal striped bars, (DAla2)GIP/xenin-8-Gln in combination with GIP(6-30)Cex-K40[Pal]; diagonally striped bars, (DAla2)GIP/xenin-8-Gln in combination with SR142948A. Values represent means ± SEM for 7 or 8 mice. *p < 0.05 and **p < 0.01 compared with glucose alone (a, b) or saline control (c, d); † p < 0.05 and †† p < 0.01 compared with (DAla2)GIP/xenin-8-Gln group
