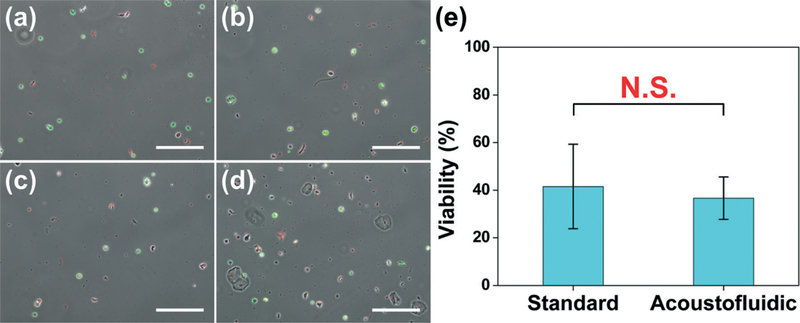
Fig. 3.

Cell viability of sputum samples liquefied using: (a)–(b) a standard sputum-liquefaction procedure; (c)–(d) our acoustofluidic sputum liquefier. (e) Statistical analysis showing the comparison of cell viability of two liquefaction procedures. Data represent an average of n = 3 to 4 independent experiments per group. In each independent experiment, over 500 cells were counted to assess cell viability. N.S. represents groups that are not statistically different (p > 0.05). Data are presented as group means ± standard deviation (SD). Scale bar: 200 μm.
