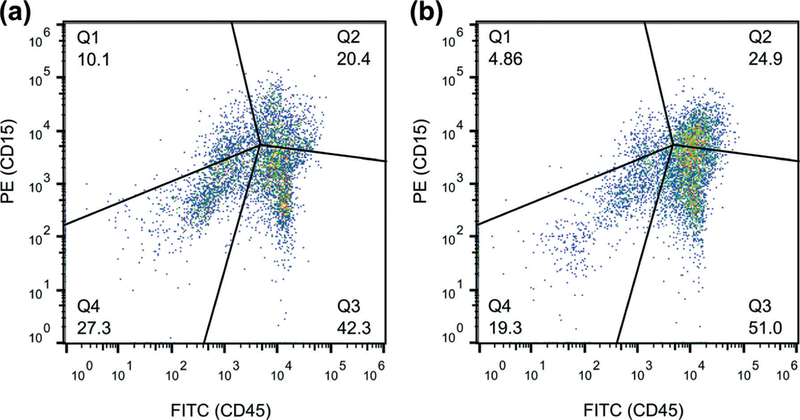
Fig. 5.

Fluorescence (CD45) vs. fluorescence (CD15) plot of the cell samples obtained from the sputum samples liquefied by (a) a standard sputum-liquefaction procedure and by (b) our acoustofluidic sputum liquefier. The percentage of co-population of eosinophils and neutrophils are 20.4% and 24.9% for (a) and (b), respectively.
