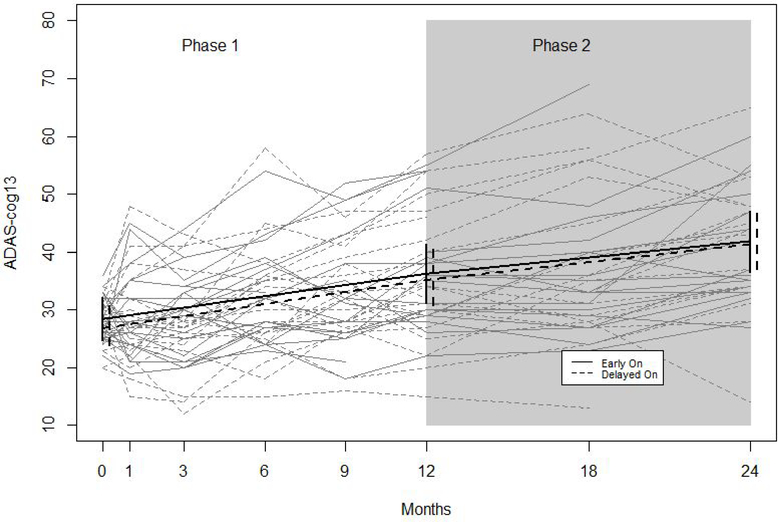
Figure 1. Observed and Model-based Trajectories of ADAS-cog 13 By Treatment Arm and Study Phase.
Figure 1 shows observed trajectories (grey) and fitted trajectories (black) from a longitudinal mixed effects model with a random intercept and adjustment for site effects. Solid lines denote trajectories of participants randomized to the early on arm, and dashed lines denote trajectories for participants randomized to the delayed on arm. Vertical lines denote 95% confidence intervals.

