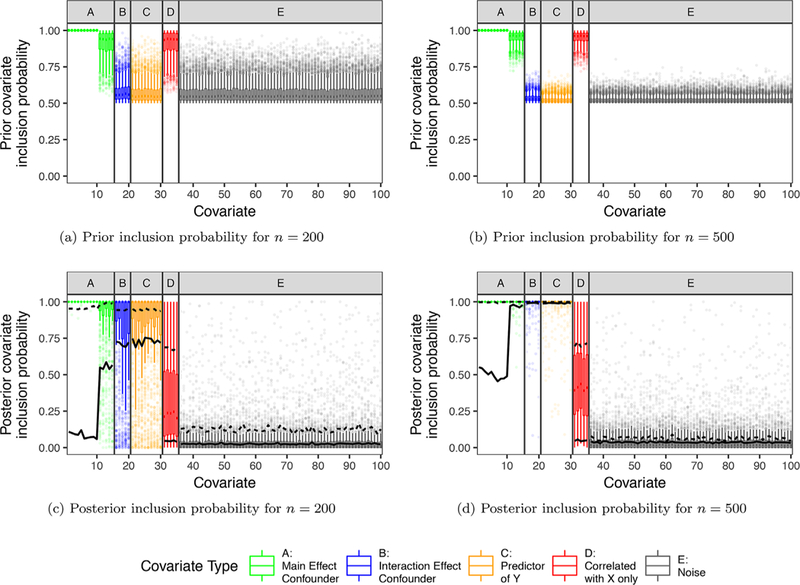
Figure 1.

Prior (top) and posterior (bottom) inclusion probabilities for each covariate in simulation scenario 1 for our proposed method. The box plots show the distribution of prior and posterior probabilities across 1000 simulated data sets. For comparison, the lines in panel 1c and d show the average posterior inclusion probability for BMA (solid line) and the proportion of times each covariate was selected into the model with BayesPen (dashed line). The variable types, denoted by the letters on the top of each panel and by color, are: (A) correlated with Y and X (covariates 1–15); (B) correlated with Y and a exposure interaction (16–20); (C) predictor of Y independent of Z (21–30); (D) correlated with X only (31–35); and (E) noise variables (36–100). This figure appears in color in the electronic version of this article.
