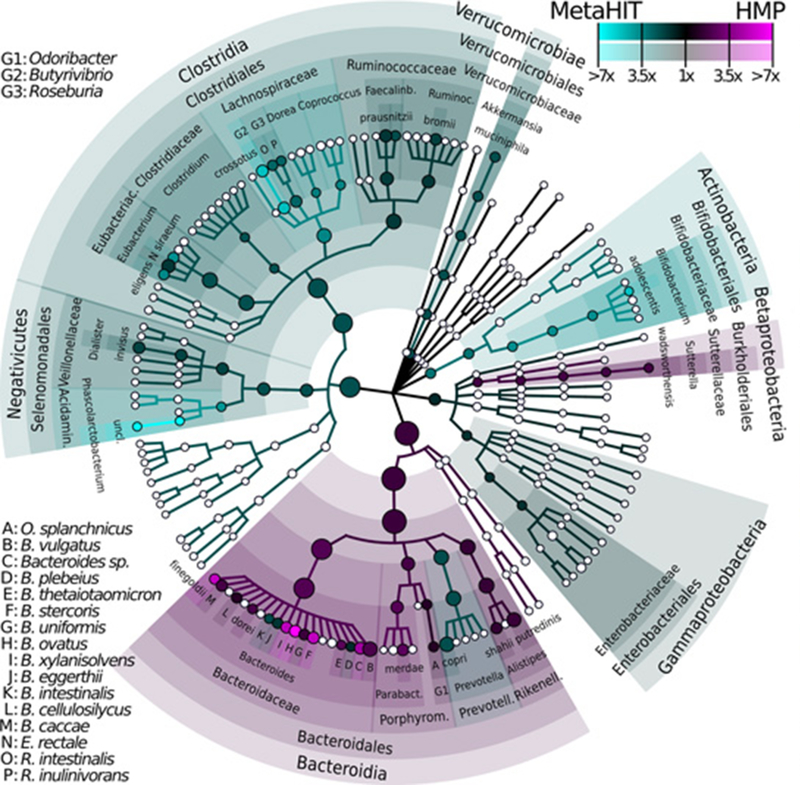
Figure 1: Phytogenetic Tree Representing Human Gut Microbiota.
Taxonomic cladogram reporting all clades present in one or both cohorts of gut microbiota in asymptomatic Western populations as inferred by MetaPhlAn on 224 samples combining Human Microbiome Project (n=139) and MetaHIT (n=85) cohorts. Circle size is proportional to the log of average abundance, color represents relative enrichment of the most abundant taxa (≥1% average in ≥1 cohort). Nodes’ size reflect their relative abundance.(143).

