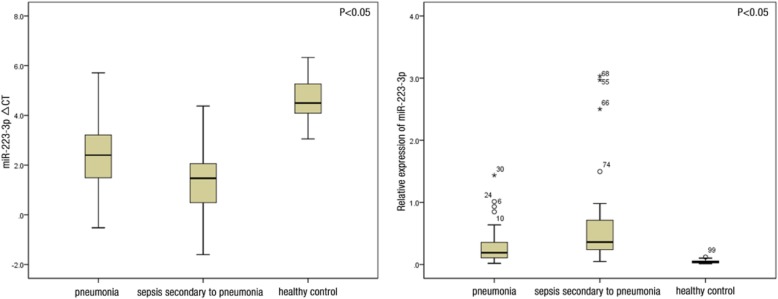
Fig. 3.
Image on the left shows that the ∆CT levels of miR-223-3p in the pneumonia, sepsis, and healthy control groups were 2.39 ± 1.36, 1.44 ± 1.43, and 4.58 ± 0.91, respectively, which were significantly different (p = 0.000). The ∆CT values of miR-223-3p significantly differed between the healthy and pneumonia groups (p = 0.000), healthy control and sepsis groups (p = 0.000), pneumonia and sepsis groups (p = 0.002). Image on the right shows that the relative expression levels of miR-223-3p in the three groups were 0.189 (0.107, 0.367), 0.361 (0.221, 0.735), and 0.044 (0.022, 0.061), which were significantly different (p = 0.000). In addition, the relative expression level of miR-223-3p significantly differed between the healthy control and pneumonia groups (p = 0.000), healthy control and sepsis groups (p = 0.000), and pneumonia and sepsis groups (p = 0.004)

