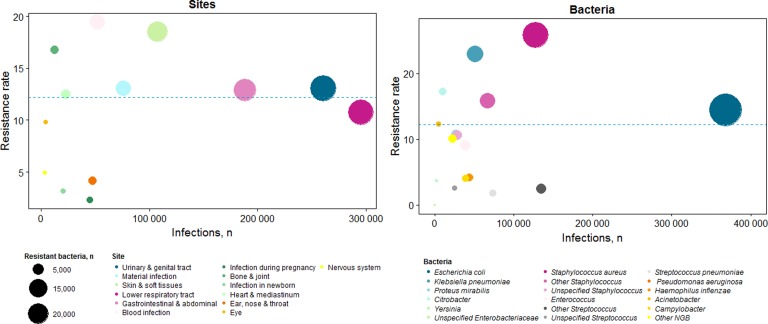
Fig. 2.
Distribution of infection sites and microorganisms according to number of stays and resistance ratea – France, 2016 (n = 1 134 858). Each colour represents an infection site or a bacteria, depending on the graph. The size of the circle represents the number of resistant infection. The total number of infections (with or without resistant bacteria) is presented on x-axis, and the percentage of resistance on y-axis.
aResistance rate: all type of resistance were considered.

